

Lab 51 – Notifications, metrics and logs: SMTP and Gotify targets, matchers, InfluxDB and Grafana, centralized logs
Dependencies
Section titled “Dependencies”- Previous labs:
- Lab 07: containers from templates;
- Lab 04: the lab proxy, configured in the Datacenter and for
apt; - Lab 41: containers from OCI images and downloads with
skopeobehind a proxy; - Lab 32 and Lab 33: the Datacenter firewall, the
managementIPSet; - Lab 46 and Lab 49: the backup jobs and the fencing that generated notifications.
- Systems: the
deso-clustercluster (desopve01-03), thecephfs(templates) andrbd-vm(container disks) storages. - New addresses: CT 151
mailpit172.27.199.151, CT 152gotify172.27.199.152, CT 153monitor172.27.199.153. - Credentials:
root@pamand the lab password → Appendix B.
Objectives
Section titled “Objectives”- The notifications of the previous labs found and delivered: the Postfix queue empty on all three nodes, the messages visible in a test mail server (Mailpit).
- An SMTP target, a Gotify target and the default
sendmailtarget, routed by two matchers: a failed backup notified through all three, with priority 9 in Gotify. - The cluster metrics in an InfluxDB 2 bucket, written with a write-only token and shown in Grafana through a read-only token.
- The logs of the three nodes collected by a central rsyslog server, one file per node and program, with times that match those of the nodes.
- The monitoring container behind its own firewall: only the nodes write metrics and logs, only the management network reaches Grafana, and a guest that is not a node is blocked.
How it works
Section titled “How it works”Notifications. Since version 8.1, every event that Proxmox VE wants to report (backups, replication, fencing, available updates, system mail) goes through a single notification system, configured in Datacenter → Notifications and saved in /etc/pve/notifications.cfg (the secrets in /etc/pve/priv/notifications.cfg).
- A target is a destination:
sendmail(uses the local MTA, that is, Postfix),smtp(talks directly to a mail server),gotify(push notifications) andwebhook(an HTTP request with a customizable body). - A matcher decides which notifications go to which targets. Its rules look at the severity (
info,notice,warning,error), at the fields of the event (for exampletype=vzdump,type=fencing,type=replication,type=package-updates,hostname,job-id) and at the calendar. Modeallrequires all rules to match, modeanyrequires just one. - A notification is checked against every matcher and goes to the targets of all the matchers that match. Each target receives it at most once, even when several matchers name it; two different targets that deliver to the same mailbox, however, produce two copies (step 6).
The default configuration has a single target, mail-to-root, which uses sendmail to send to the email address of root@pam, and a matcher, default-matcher, that sends everything to it. Mail that local services such as smartd send to the root user also enters the notification system, as events of type system-mail.
Metrics. Every node periodically sends the statistics of nodes, guests and storages to one or more metric servers: Graphite or InfluxDB (the current documentation also lists OpenTelemetry). With InfluxDB 2 you use the HTTP(S) protocol with an organization, a bucket and a token. Proxmox VE keeps no history beyond its RRD graphs: for long-term history, alerts and dashboards you use an external database such as InfluxDB and a tool such as Grafana.
Logs. The Proxmox VE services write to the systemd journal: pveproxy (web interface and API), pvedaemon (privileged operations), pve-cluster (the /etc/pve file system), corosync, pve-ha-crm and pve-ha-lrm (high availability), pvestatd (statistics). Every operation started from the interface or the API is a task with an identifier (UPID) and its own log in /var/log/pve/tasks/. To have the logs of all nodes in one place, and to keep them even if a node fails, you forward them to a central server.
Test environment and versions
Section titled “Test environment and versions”The outputs in this lab come from a run on 10 November 2026, the date in the logs and in the tasks, with the configuration below. Some of the behaviours described depend on versions and defaults, for example which targets use the proxy, or the timestamp format of forwarded logs: on a different system, check them again.
| Component | Configuration used |
|---|---|
| Proxmox VE | 9.2.26, kernel 7.0.14-28-pve, three-node cluster deso-cluster, nodes in the Europe/Rome time zone (Lab 03, Lab 04) |
| Mail on the nodes | Postfix as installed by Proxmox VE, with no relayhost until step 6 |
| Lab proxy | filter on a list of domains (Lab 01), set as the Datacenter HTTP proxy (Lab 04) |
| CT 151 and CT 152 | OCI images axllent/mailpit:latest and gotify/server:latest, downloaded on 10 November 2026; the Gotify web interface shows version 3.1.1, the Mailpit version was not recorded |
CT 153 monitor |
Debian 13 (template debian-13-standard_13.6-1), InfluxDB 2.9.1, Grafana 13.3.0, rsyslog 8.2504.0; time zone UTC when created |
| Log forwarding | rsyslog installed on the nodes from the Debian repositories, omfwd over TCP with its default template |
What the test shows, and what it does not. Each path (email, push, metrics, logs) is checked with at least one real message, in this configuration. The test does not cover delivery while the mail server is down (the SMTP target does not retry), the critici-push rule on fencing (no fencing happened after the matcher was created), the rsyslog queue during an outage of the central server, how long data takes to arrive, or behaviour under load.
Procedure
Section titled “Procedure”1. Where did the notifications go?
Section titled “1. Where did the notifications go?”The default configuration, with only the mail-to-root target:
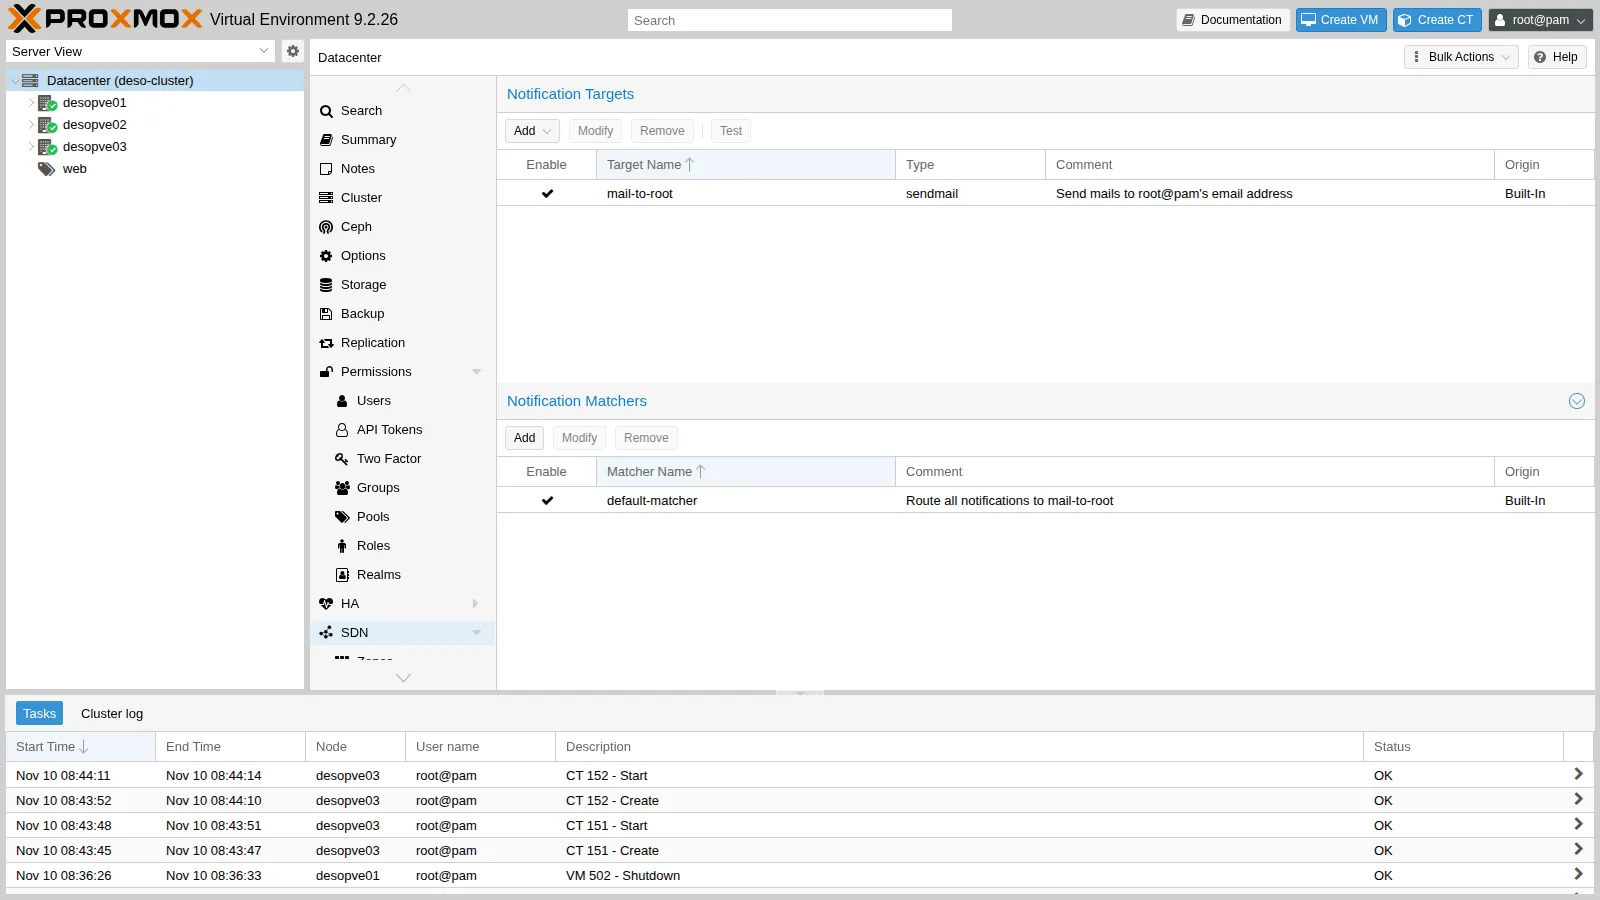
The address of root@pam is [email protected], set during the installation in Lab 03. Nobody, however, has ever read the notifications of the previous labs. The Postfix queue on desopve01:
postqueue -p | head -8-Queue ID- --Size-- ----Arrival Time---- -Sender/Recipient-------4339E298E9* 9722 Tue Nov 10 04:37:39 [email protected]
C321B2A7B8 7395 Tue Nov 10 05:09:22 [email protected] (connect to proxmox.community[fd27:199::20]:25: Connection timed out)Across the three nodes, 31 messages are waiting in the queue, among them the fencing notifications of Lab 49:
desopve01 7A1F02D550 | Subject: Trying to fence node 'desopve03'desopve01 93AAE2D572 | Subject: Successfully fenced node 'desopve03'desopve02 1EE3118167 | Subject: Replication Job: '100-1' faileddesopve01 4339E298E9 | Subject: vzdump backup status (desopve01.proxmox.community): backup successful…Why they had not been delivered:
- Observed: for the second message, Postfix records the reason
connect to proxmox.community[fd27:199::20]:25: Connection timed out;fd27:199::20is the IPv6 address of the domain controller (Lab 25). The two messages shown entered the queue at 04:37 and 05:09 on 10 November, the day of the test. - Interpretation: this is consistent with a domain that has no MX record in the lab DNS. Without one, an SMTP client delivers to the addresses of the domain itself (the implicit MX of RFC 5321), and here those belong to the domain controller, which runs no mail service (Lab 02). Postfix keeps retrying a deferred message, by default for up to five days (
maximal_queue_lifetime), and only then treats it as undeliverable: until then, nothing visible happens. A timeout, unlike a refused connection, does not tell you whether nothing listens on port 25 or a filter drops the connection. - How to check: on the domain controller,
Resolve-DnsName proxmox.community -Type MX -DnsOnlyshould return no MX record, whileResolve-DnsName proxmox.community -DnsOnlylists the addresses Postfix tries. On a node,journalctl -t postfix/smtp | grep deferredshows every failed attempt with its reason, andpostqueue -pthe arrival time of each message still waiting.
A notification that nobody receives is as good as no notification. The first check after installing a cluster is to verify that the emails actually arrive.
2. A test mail server: Mailpit
Section titled “2. A test mail server: Mailpit”In the lab you don’t need a real mail server: an SMTP “sink” that accepts every message and shows it in a web page is enough. Mailpit is a 15 MB OCI image. As in Lab 41, skopeo does not use the Datacenter proxy, so you pass the proxy in the environment variable:
cd /mnt/pve/cephfs/template/cacheHTTPS_PROXY=http://proxy.proxmox.community:3128 skopeo copy \  docker://docker.io/axllent/mailpit:latest oci-archive:axllent_mailpit_latest.tarHTTPS_PROXY=http://proxy.proxmox.community:3128 skopeo copy \  docker://docker.io/gotify/server:latest oci-archive:gotify_server_latest.tar
# on desopve03pct create 151 cephfs:vztmpl/axllent_mailpit_latest.tar --hostname mailpit --unprivileged 1 \ --memory 256 --rootfs rbd-vm:2 --net0 name=eth0,bridge=vmbr0,ip=172.27.199.151/24,gw=172.27.199.1pct start 151Detected OCI archiveAuto-Enabling host-managed network for network device net0.Detected container architecture: amd64Proxmox VE takes the process to start from the image (entrypoint: /mailpit). Mailpit receives mail on port 1025 and shows the messages at http://172.27.199.151:8025.
3. SMTP target
Section titled “3. SMTP target”Datacenter → Notifications → Add → SMTP: Endpoint Name mailpit, server 172.27.199.151, port 1025, encryption None (insecure) because the sink has no TLS, no authentication, sender [email protected], recipient [email protected].
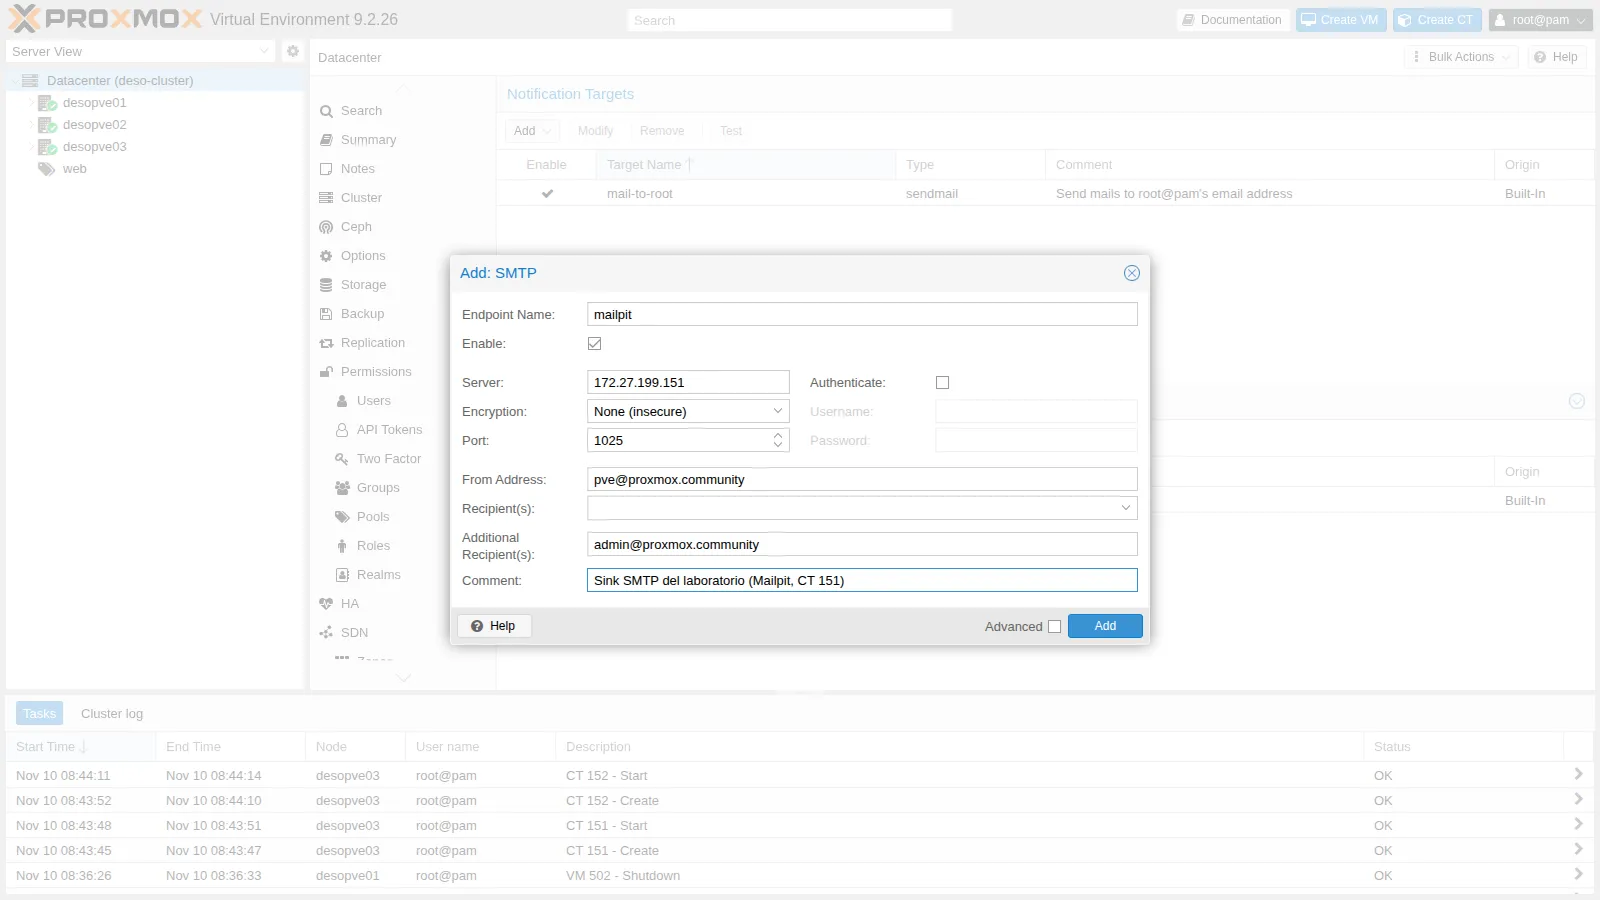
In production you use the company mail server or an external service with STARTTLS or TLS and a dedicated user. The password ends up in /etc/pve/priv/notifications.cfg, readable only by root.
Unlike sendmail, the SMTP target does not go through Postfix: Proxmox VE connects to the mail server itself, so the messages waiting in the local queue do not hold it up. The flip side, according to the documentation, is that the SMTP target has no queue and does not retry: a notification sent while the mail server is unreachable is lost. This lab does not test that case. The Test button sends a test message, which shows up in Mailpit immediately.
4. Gotify target and a trap: the Datacenter proxy
Section titled “4. Gotify target and a trap: the Datacenter proxy”Gotify is a push notification server with a smartphone app. Container 152 is created from the image downloaded in step 2, like 151, on the same node desopve03:
pct create 152 cephfs:vztmpl/gotify_server_latest.tar --hostname gotify --unprivileged 1 --memory 256 \ --rootfs rbd-vm:2 --net0 name=eth0,bridge=vmbr0,ip=172.27.199.152/24,gw=172.27.199.1pct start 152At first start the user is admin/admin: you change the password and create an application, which provides the token for sending messages:
curl -s -u admin:admin -X POST http://172.27.199.152/current/user/password \ -H 'Content-Type: application/json' -d '{"pass":"<lab-password>"}'curl -s -u 'admin:<lab-password>' -X POST http://172.27.199.152/application \ -H 'Content-Type: application/json' -d '{"name":"Proxmox VE","description":"Notifiche del cluster deso-cluster"}'The token goes into the Gotify target (Endpoint Name gotify):
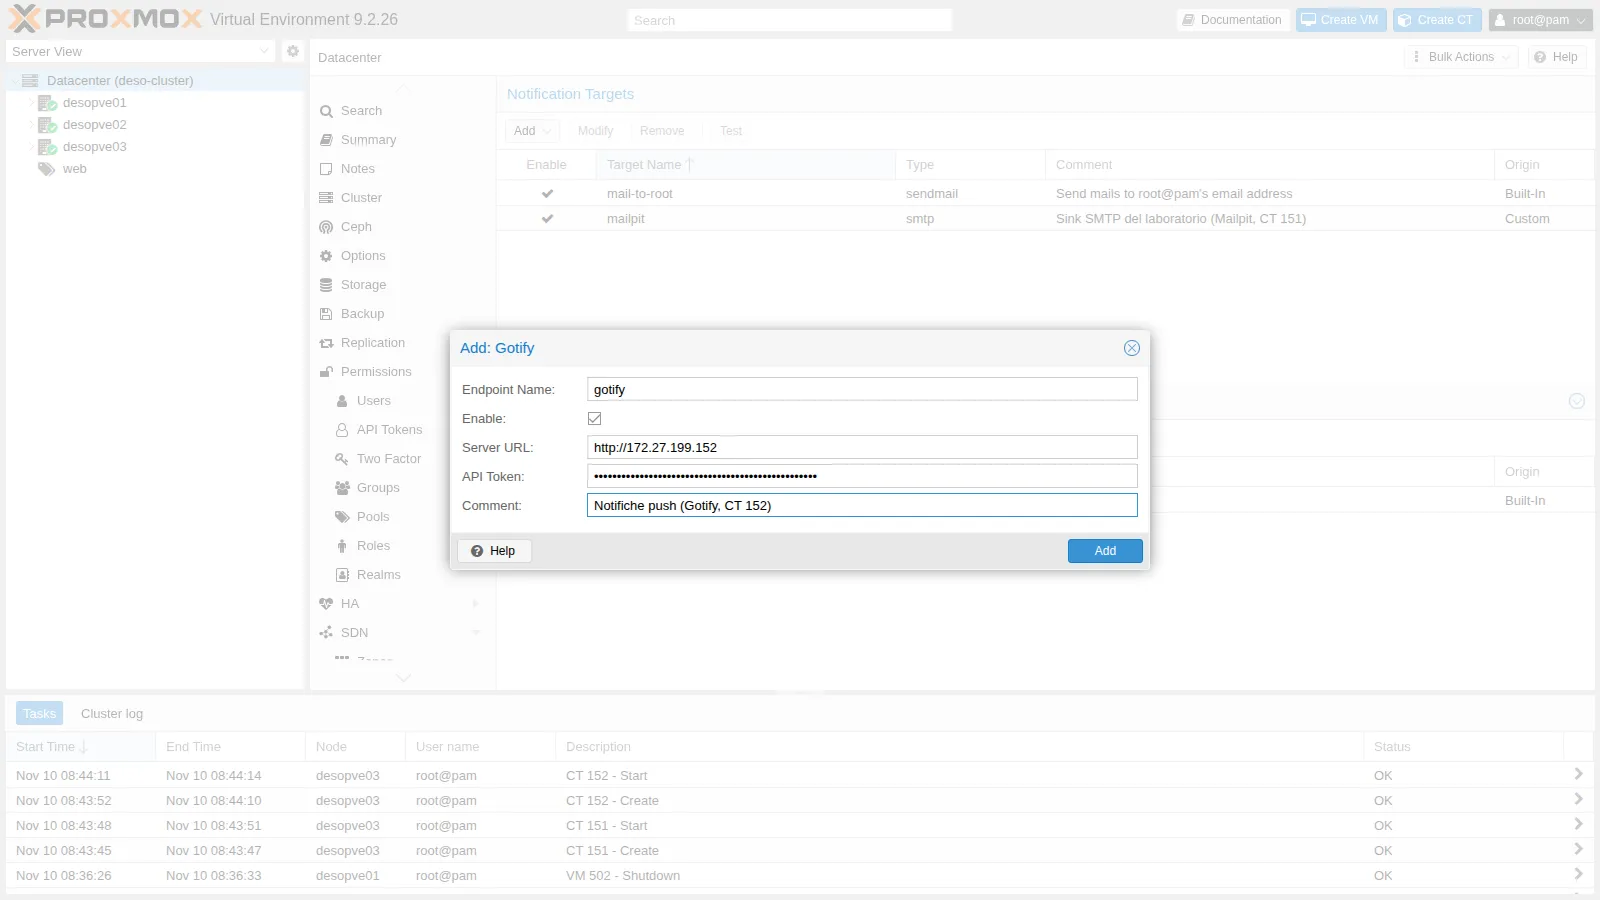
Configuration tried. The Gotify target points to http://172.27.199.152, while the Datacenter HTTP proxy of Lab 04 is still set.
Error observed. The test fails:
pvesh create /cluster/notifications/targets/gotify/test500 Could not test target: could not notify via endpoint(s): gotify: CONNECT proxy failed: proxy server responded 403/403The proxy log shows the request to the internal address, refused by the filter:
CONNECT Nov 10 07:49:34.599 [91799]: Request (file descriptor 5): CONNECT 172.27.199.152:80 HTTP/1.1NOTICE Nov 10 07:49:34.603 [91799]: Proxying refused on filtered domain "172.27.199.152"So the Gotify target sent its request through the Datacenter HTTP proxy, although the destination is an internal address. The documentation states this for the Gotify target. For the Webhook target it says nothing, but in the current source code that target builds its HTTP client with the same proxy setting. This lab tested only Gotify; to check the Webhook target, test one and look for its request in the proxy log.
Decision. The lab proxy accepts only a list of external domains: let the internal destinations of the management network (172.27.199.0/24 and *.proxmox.community) through as well, as described in Lab 01. In a company, you ask whoever manages the proxy for the same exception.
Result. The test message arrives in Gotify:
Test notification | 1 | ``` This is a test of the notification target 'gotify'. ```The SMTP target and the InfluxDB metric server of step 7, on the other hand, do not go through the proxy: no request to their ports appears in the proxy log.
5. Matchers: who receives what
Section titled “5. Matchers: who receives what”Two new matchers, created from the command line:
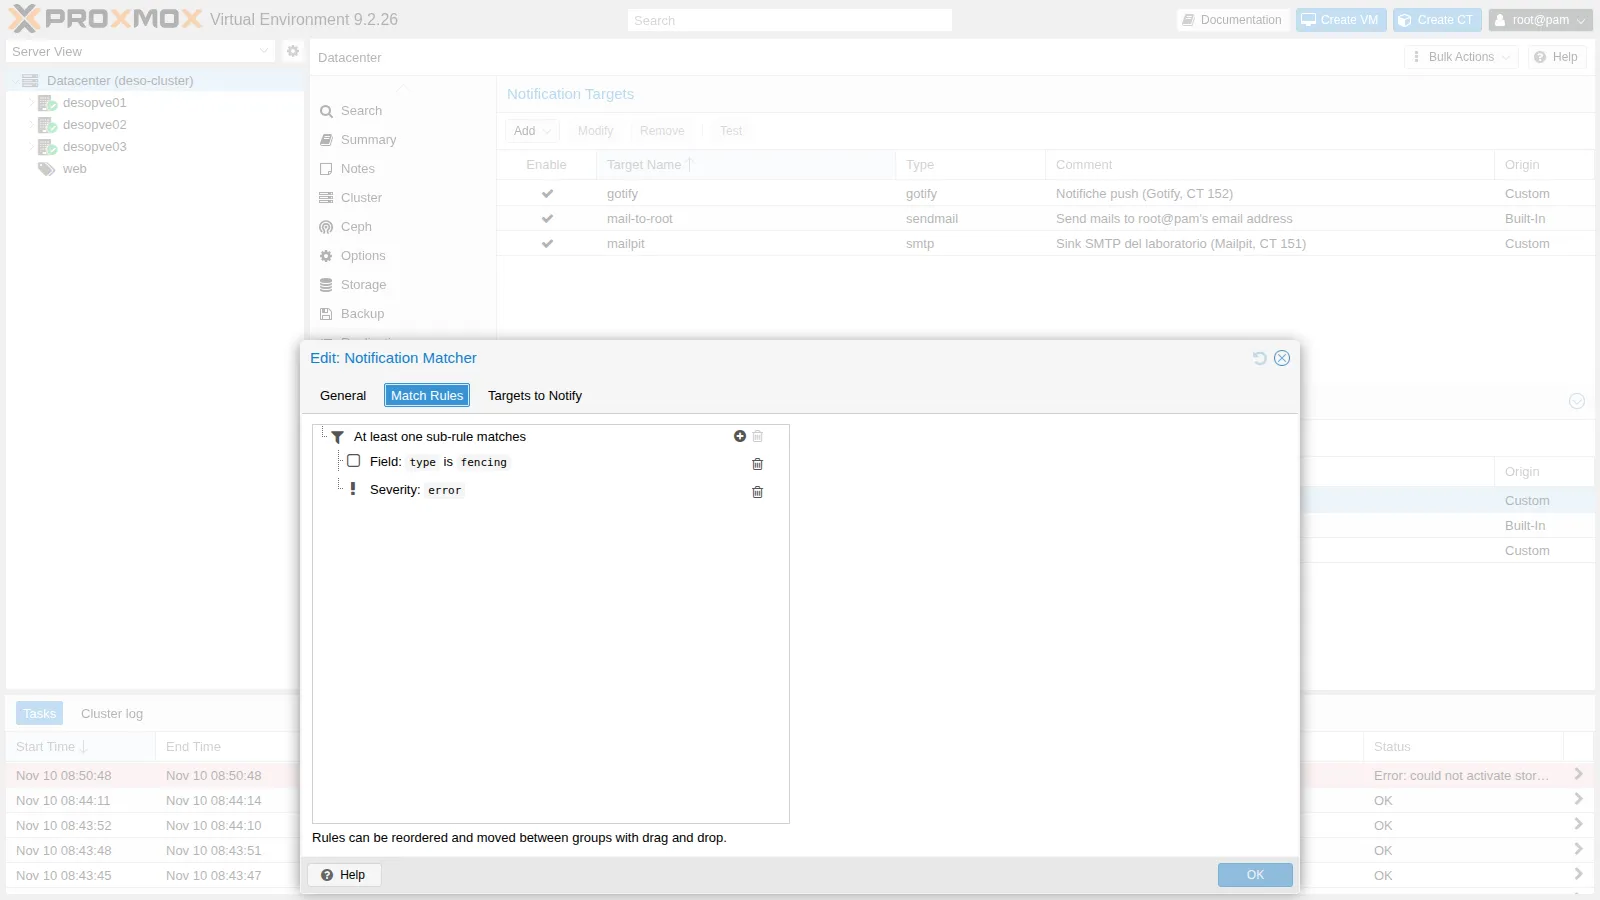
pvesh create /cluster/notifications/matchers --name tutto-a-mailpit --mode all \ --target mailpit --comment "Ogni notifica anche al sink SMTP del laboratorio"pvesh create /cluster/notifications/matchers --name critici-push --mode any \ --match-severity error --match-field exact:type=fencing \ --target gotify --comment "Errori e fencing anche su Gotify"The result in /etc/pve/notifications.cfg:
matcher: tutto-a-mailpit  comment Ogni notifica anche al sink SMTP del laboratorio  mode all  target mailpit
matcher: critici-push  comment Errori e fencing anche su Gotify  match-field exact:type=fencing  match-severity error  mode any  target gotify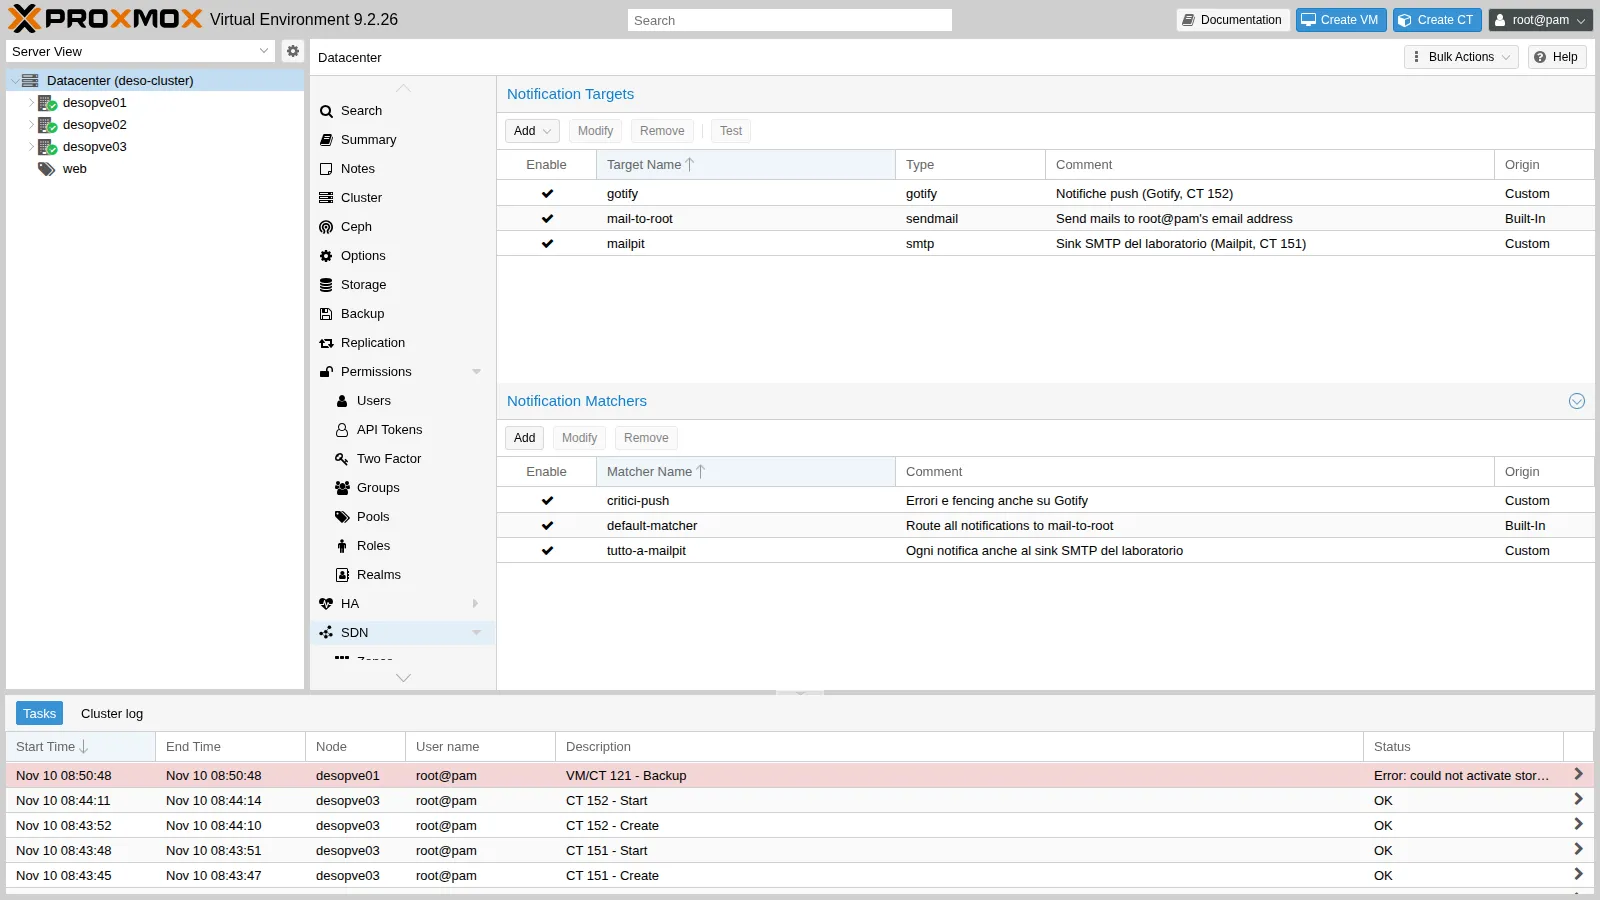
In the critici-push matcher, mode any makes it match an error or a fencing event: the rule on the type field catches fencing notifications whatever their severity, including the one for a successful fencing. No fencing happened in this lab after the matcher was created, so the rule on type=fencing was not exercised. At the next fencing, for example by repeating the test of Lab 49, the messages should show up in Gotify, and the journal of pve-ha-crm should record notified via target `gotify`.
6. Unblocking the Postfix queue and testing a real error
Section titled “6. Unblocking the Postfix queue and testing a real error”Postfix is still needed: the sendmail target (mail-to-root) hands its messages to it, and local services such as smartd and cron send their mail to root through it, mail that Proxmox VE then feeds into the notification system as system-mail. Have Postfix deliver to the lab mail server, on every node:
postconf -e 'relayhost = [172.27.199.151]:1025'postfix reloadpostqueue -fpostqueue -p | tail -1Mail queue is emptyThe square brackets tell Postfix not to look up MX records and to use that address directly. The 31 messages that were waiting arrive in Mailpit, together with the test message of step 3:
totale 3228 vzdump backup status1 Replication Job: '100-1' failed1 Successfully fenced node 'desopve03'1 Trying to fence node 'desopve03'1 Test notification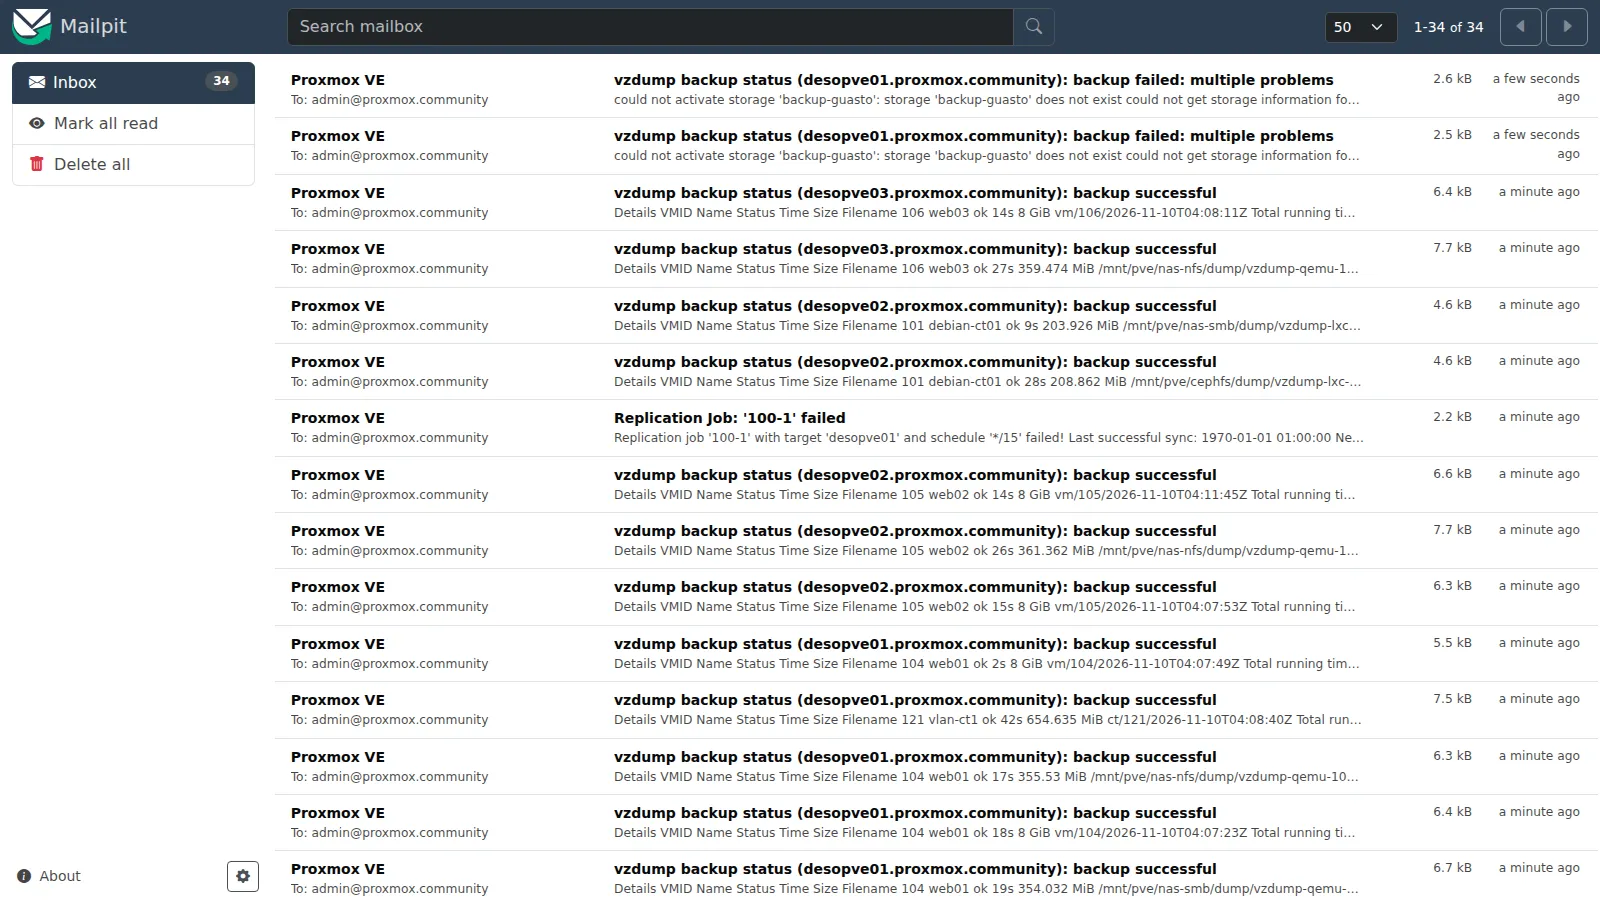
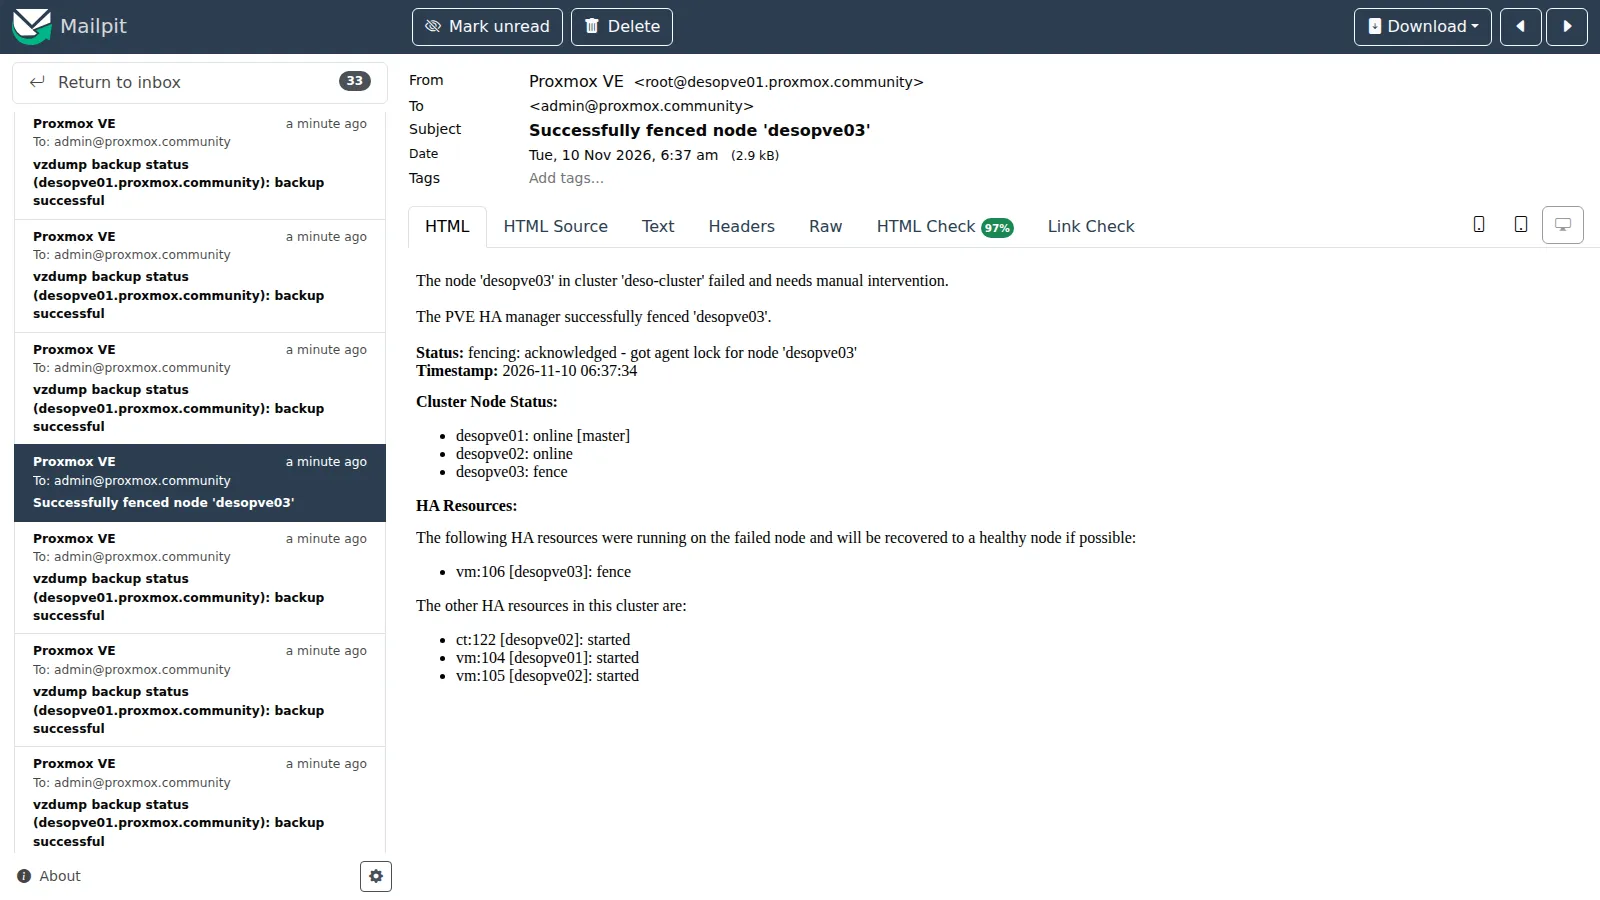
The fencing notification of Lab 49 describes what happened and which HA resources were recovered:
To test the error path you need a real error. A backup to a storage that does not exist:
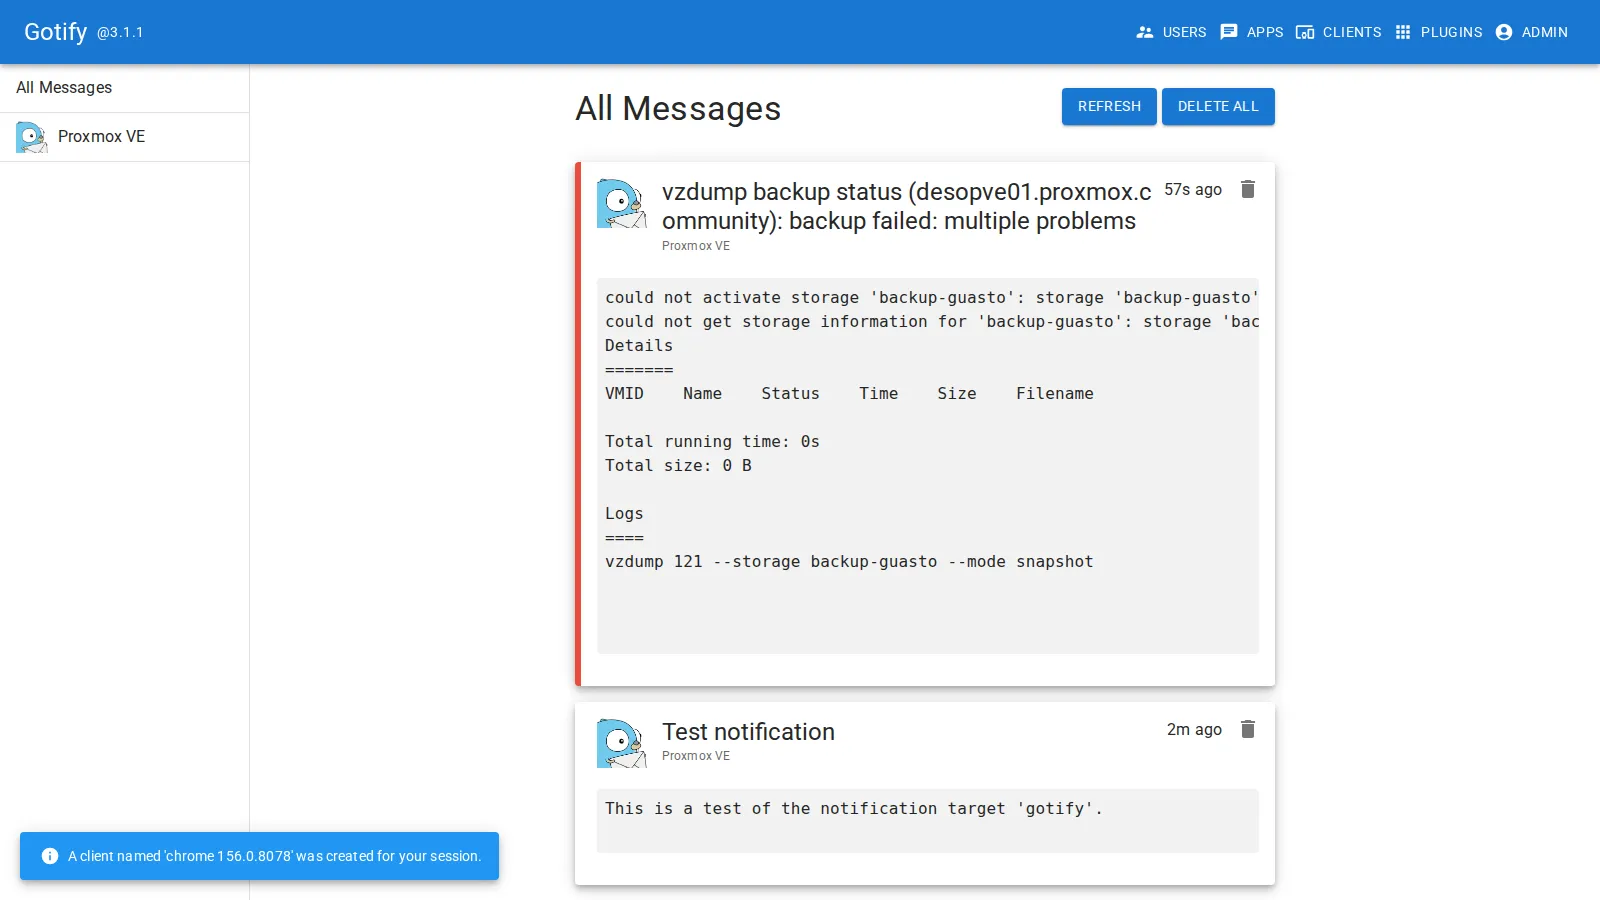
vzdump 121 --storage backup-guasto --mode snapshotINFO: notified via target `mail-to-root`INFO: notified via target `mailpit`INFO: notified via target `gotify`could not activate storage 'backup-guasto': storage 'backup-guasto' does not exist could not get storage information for 'backup-guasto': storage 'backup-guasto' does not existThe task log names three targets, and the notification arrives in Mailpit twice. That is consistent with the two paths that now end in Mailpit: mail-to-root through Postfix and its relayhost, and the SMTP target directly. To check it, compare the headers of the two copies: only the one that went through Postfix carries a Received header added by the node’s Postfix. In Gotify the message has priority 9. The Gotify target derives the priority from the severity: in the source code of the notification library, error becomes 9, the highest value it uses (warning 5, notice 3, info 1):
7. Metrics: InfluxDB 2 and Grafana
Section titled “7. Metrics: InfluxDB 2 and Grafana”A dedicated Debian 13 container, CT 153 monitor, with InfluxDB 2, Grafana and rsyslog from the official repositories (through the proxy):
# on desopve03pct create 153 cephfs:vztmpl/debian-13-standard_13.6-1_amd64.tar.zst --hostname monitor \ --unprivileged 1 --features nesting=1 --cores 2 --memory 2048 --swap 512 --rootfs rbd-vm:10 \ --net0 name=eth0,bridge=vmbr0,ip=172.27.199.153/24,gw=172.27.199.1 \ --nameserver 172.27.199.20 --searchdomain proxmox.community --password '<lab-password>'pct start 153pct enter 153Inside the container:
echo 'Acquire::http::Proxy "http://proxy.proxmox.community:3128";' > /etc/apt/apt.conf.d/80proxyexport https_proxy=http://proxy.proxmox.community:3128apt-get update && apt-get install -y curl gpginstall -d -m 0755 /etc/apt/keyringscurl -fsSL https://repos.influxdata.com/influxdata-archive.key | gpg --dearmor -o /etc/apt/keyrings/influxdata.gpgcurl -fsSL https://apt.grafana.com/gpg.key | gpg --dearmor -o /etc/apt/keyrings/grafana.gpgecho "deb [signed-by=/etc/apt/keyrings/influxdata.gpg] https://repos.influxdata.com/debian stable main" > /etc/apt/sources.list.d/influxdata.listecho "deb [signed-by=/etc/apt/keyrings/grafana.gpg] https://apt.grafana.com stable main" > /etc/apt/sources.list.d/grafana.listapt-get update && apt-get install -y influxdb2 influxdb2-cli grafana rsyslogsystemctl enable --now influxdb grafana-servergrafana 13.3.0influxdb2 2.9.1-1rsyslog 8.2504.0-1+deb13u2Initial InfluxDB setup: organization proxmox, bucket pve with 30 days of retention, and two separate tokens, one that can only write (for Proxmox VE) and one that can only read (for Grafana):
influx setup --org proxmox --bucket pve --username admin --password '<lab-password>' --retention 30d --forceBID=$(influx bucket list --org proxmox --name pve --hide-headers | cut -f1)influx auth create --org proxmox --write-bucket $BID --description pve-scritturainflux auth create --org proxmox --read-bucket $BID --description grafana-letturaIn Proxmox VE: Datacenter → Metric Server → Add → InfluxDB, ID influx-monitor, protocol HTTP, server 172.27.199.153, port 8086, organization proxmox, bucket pve, write token.
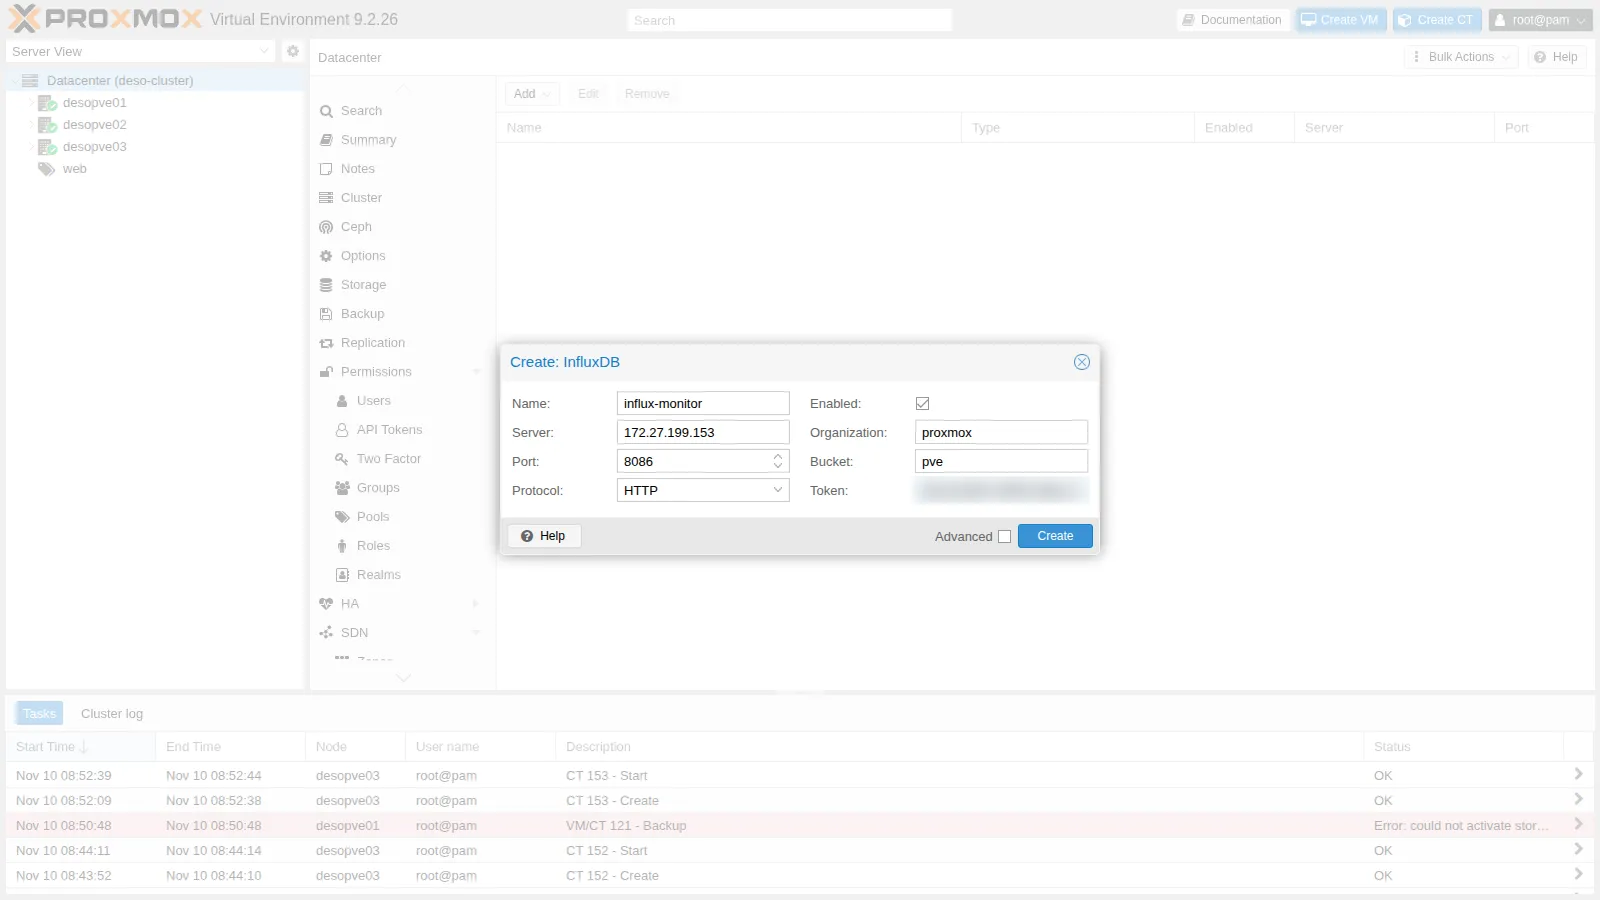
The configuration ends up in /etc/pve/status.cfg, valid for all nodes:
influxdb: influx-monitor port 8086 server 172.27.199.153 bucket pve influxdbproto http organization proxmoxThe data starts arriving after a few seconds. The measurements present in the bucket and the latest CPU value of two nodes:
ballooninfo blockstat cpustat memory nics proxmox-support system host:string _value:float---------------------- ---------------------------- desopve02 0.146134663341646 desopve03 0.2536In Grafana (http://172.27.199.153:3000) you add a data source of type InfluxDB with the Flux query language, organization proxmox, bucket pve and the read-only token. The test answers datasource is working. 1 buckets found. Then you import the public dashboard “Proxmox Cluster [Flux]” (ID 15356 on grafana.com). An import by ID is downloaded by the grafana-server service, not by the browser, and in this lab the service has no proxy: the https_proxy variable exported earlier applies only to that shell. So download the JSON from the container, through the proxy (which must allow the grafana.com domain), and upload it with Dashboards → New → Import → Upload dashboard JSON file, associating it with this data source:
curl -x http://proxy.proxmox.community:3128 -fsS -o /root/proxmox-flux.json \ https://grafana.com/api/dashboards/15356/revisions/latest/download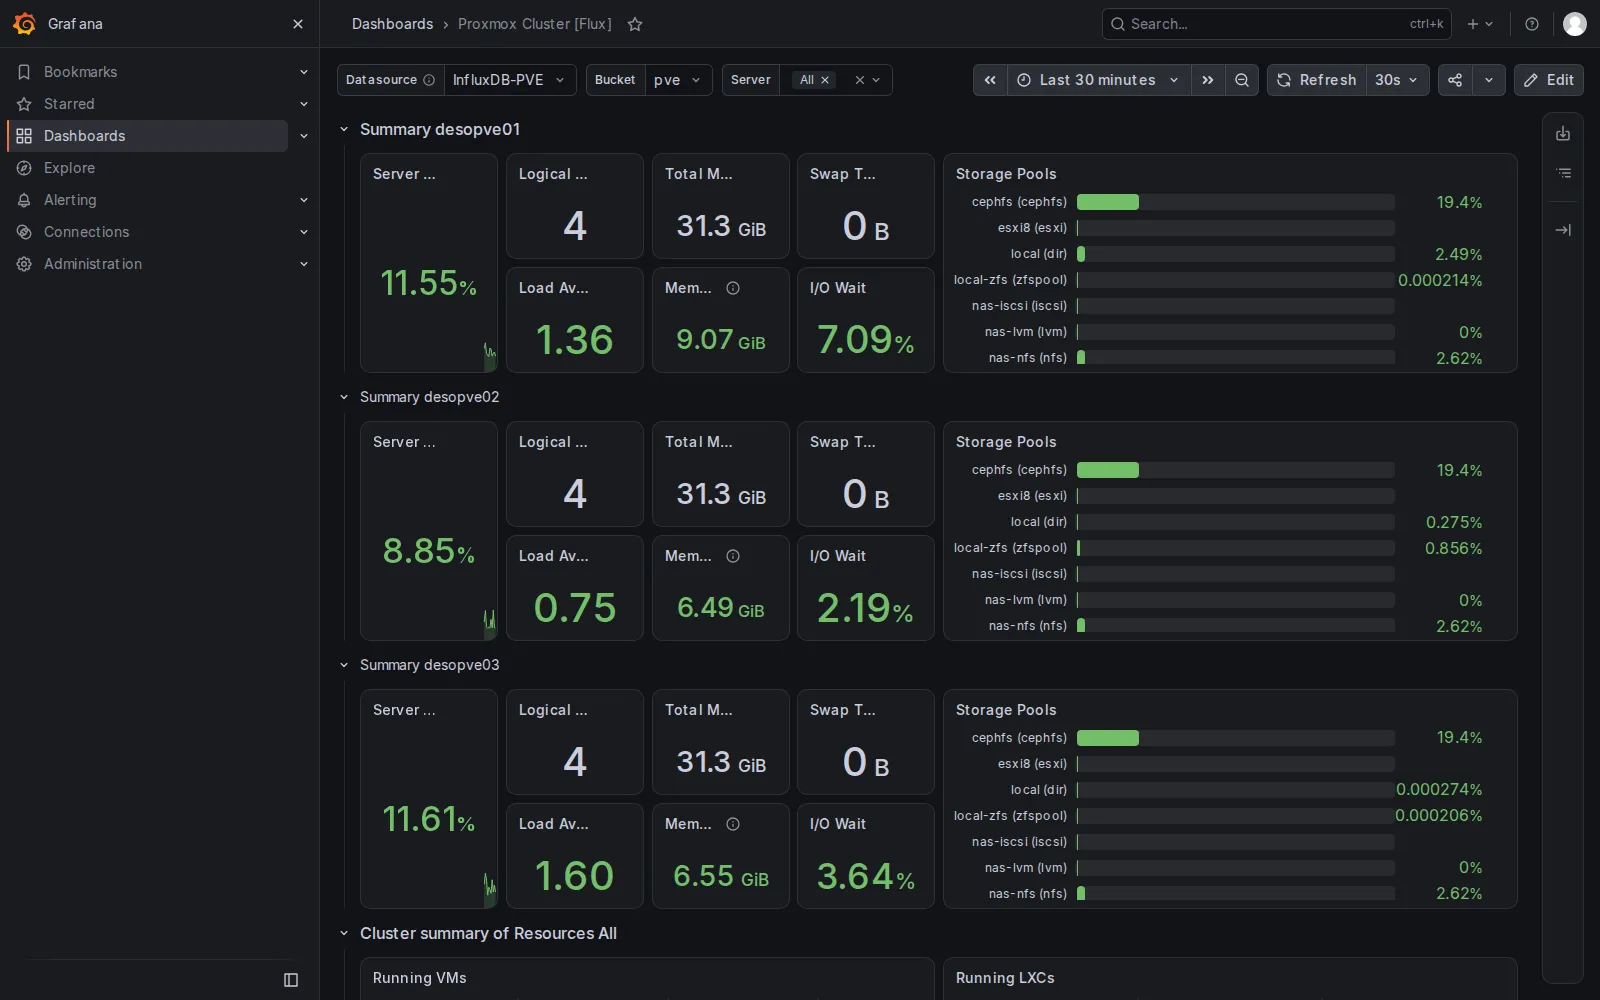
If you completed Lab 50, the list of storages also includes the import storage, which has no space of its own.
8. Logs: journal, tasks and centralized forwarding
Section titled “8. Logs: journal, tasks and centralized forwarding”The journal keeps the history of the services. The fencing of Lab 49, as seen by the HA manager on desopve01:
journalctl -u pve-ha-crm --since "2026-11-10 06:35" --until "2026-11-10 06:40" -o short-iso | grep -iE "fenc|recover|node .desopve03"2026-11-10T06:35:54+01:00 desopve01 pve-ha-crm[1679]: node 'desopve03': state changed from 'online' => 'unknown'2026-11-10T06:36:44+01:00 desopve01 pve-ha-crm[1679]: service 'vm:106': state changed from 'started' to 'fence'2026-11-10T06:36:44+01:00 desopve01 pve-ha-crm[1679]: node 'desopve03': state changed from 'unknown' => 'fence'2026-11-10T06:37:44+01:00 desopve01 pve-ha-crm[1679]: fencing: acknowledged - got agent lock for node 'desopve03'2026-11-10T06:37:44+01:00 desopve01 pve-ha-crm[1679]: recover service 'vm:106' from fenced node 'desopve03' to node 'desopve02'Corosync, on the same node, had logged the loss of both links to host 3, that is desopve03, 16 seconds earlier:
2026-11-10T06:35:38+01:00 desopve01 corosync[120106]: [KNET ] link: host: 3 link: 0 is down2026-11-10T06:35:38+01:00 desopve01 corosync[120106]: [KNET ] link: host: 3 link: 1 is down2026-11-10T06:35:38+01:00 desopve01 corosync[120106]: [KNET ] host: host: 3 has no active linksThe two services record different events: Corosync the loss of the links, the HA manager its change of state, the fence and the recovery. Lab 49 discusses the time between them.
The tasks of the node, with the failed backup of step 6:
pvenode task list --limit 4tail -n 1 /var/log/pve/tasks/index│ UPID:desopve01:000AED42:0064A85D:6AF2CCD8:vzdump:121:root@pam: │ vzdump │ 121 │ root@pam │ 2026-11-10 08:50:48 │ 2026-11-10 08:50:48 │ ERROR │UPID:desopve01:000AED42:0064A85D:6AF2CCD8:vzdump:121:root@pam: 6AF2CCD8 could not activate storage 'backup-guasto': storage 'backup-guasto' does not exist …The central server is rsyslog in CT 153, which receives on TCP 514 and writes one file per node and per program:
# /etc/rsyslog.d/10-ricezione.conf (CT 153)module(load="imtcp")input(type="imtcp" port="514" ruleset="remoti")template(name="PerHost" type="string" string="/var/log/remote/%HOSTNAME%/%PROGRAMNAME%.log")ruleset(name="remoti") { action(type="omfile" dynaFile="PerHost" createDirs="on")}Proxmox VE 9 nodes use only the journal: rsyslog has to be installed. On every node:
apt-get install -y rsyslogcat > /etc/rsyslog.d/90-remoto.conf <<'EOF'*.* action(type="omfwd" target="172.27.199.153" port="514" protocol="tcp" queue.type="LinkedList" queue.filename="inoltro-remoto" queue.saveOnShutdown="on" action.resumeRetryCount="-1")EOFsystemctl restart rsysloglogger -t lab51 "prova di inoltro da $(hostname)"With queue.filename, the forwarding queue becomes disk-assisted: while the central server is unreachable, rsyslog keeps the messages and retries indefinitely (action.resumeRetryCount="-1"). According to the rsyslog documentation, the messages stay in memory and are written to disk only when the in-memory queue fills up or at an orderly shutdown (queue.saveOnShutdown): a crash or a power loss of the node loses what was still in memory. This lab did not test an outage of the central server. To check it, stop rsyslog on CT 153, send a few messages with logger from a node, start rsyslog again and look for them in /var/log/remote/.
The test messages arrive on CT 153 and, when you restart CT 101 on desopve02, so do the real tasks:
2026-11-10T08:57:33+00:00 desopve01 lab51: prova di inoltro da desopve012026-11-10T08:57:40+00:00 desopve02 lab51: prova di inoltro da desopve022026-11-10T08:57:48+00:00 desopve03 lab51: prova di inoltro da desopve032026-11-10T08:58:03+00:00 desopve02 pct[632504]: <root@pam> end task UPID:desopve02:0009A6B9:0053EFD3:6AF2CE89:vzstop:101:root@pam: OK2026-11-10T08:58:07+00:00 desopve02 pct[632503]: <root@pam> end task UPID:desopve02:0009A6D8:0053F113:6AF2CE8C:vzstart:101:root@pam: OKConfiguration tried. The nodes forward with omfwd and its default template; CT 153 keeps the time zone it was created with, UTC.
Behaviour observed. On CT 153 the lines carry the offset +00:00, while the journal of the nodes shows +01:00. The UPID of each task holds its start time in hexadecimal (date -u -d @$((16#6AF2CE89)) decodes it): vzstop starts at 07:58:01 UTC, the following vzstart at 07:58:04 UTC. CT 153 records the end of vzstop at 08:58:03+00:00. Read as UTC, the stop would have lasted an hour and ended after the next task had started; read with the nodes’ offset, it ends at 07:58:03 UTC, two seconds after it began. The times on CT 153 are therefore the nodes’ local times, labelled as UTC.
Interpretation. This is consistent with the nodes sending their local time without a time zone, and with CT 153 attaching its own, UTC. The default template of omfwd, RSYSLOG_TraditionalForwardFormat, uses the traditional timestamp, which carries neither a time zone nor fractions of a second, just like the lines received. To check it, send a message with logger from a node and compare the line received with date -u on the node, or look at the forwarded messages with tcpdump -A -i vmbr0 tcp port 514 on the node.
Decision. Bring CT 153 to the nodes’ time zone with timedatectl set-timezone Europe/Rome.
Result. The times match those of the nodes. This works because nodes and server share the same time zone. A forwarding format that carries the offset, such as RSYSLOG_ForwardFormat (template="RSYSLOG_ForwardFormat" in the omfwd action), would make the timestamps independent of the server’s time zone; it was not tested in this lab.
9. Firewall for the new services
Section titled “9. Firewall for the new services”In the configuration of Lab 33, the host firewall of the nodes has no outbound rules and keeps the default outbound policy, ACCEPT: metrics, logs and notifications leave the nodes as outgoing connections, so they are not affected. The monitor container, on the other hand, exposes three services and must be protected. An IPSet with the nodes, and the rules of the container:
pvesh create /cluster/firewall/ipset --name nodi-pve --comment "Nodi Proxmox VE del laboratorio"for i in 21 22 23 24; do pvesh create /cluster/firewall/ipset/nodi-pve --cidr 172.27.199.$i; doneCreate /etc/pve/firewall/153.fw with this content (or create the same rules from CT 153 → Firewall):
# /etc/pve/firewall/153.fw[OPTIONS]enable: 1policy_in: DROP
[RULES]IN ACCEPT -source +nodi-pve -p tcp -dport 8086 -log nolog # metriche dai nodi verso InfluxDBIN ACCEPT -source +nodi-pve -p tcp -dport 514 -log nolog # log dei nodi verso rsyslogIN ACCEPT -source +management -p tcp -dport 3000 -log nolog # Grafana dalla rete di gestioneIN SSH(ACCEPT) -source +management -log nologIN Ping(ACCEPT) -log nolog
Finally, set firewall=1 on the network device of the container (pct set 153 --net0 …,firewall=1).
Verification and tests
Section titled “Verification and tests”The lab has succeeded when every path delivers at least one real message: a notification in Mailpit and in Gotify, data in the InfluxDB bucket and in Grafana, a line from every node in /var/log/remote/ on CT 153. The firewall of CT 153 must then block a connection from a guest that is not a node, without stopping metrics and logs.
| Check | Success criterion | Observed in the lab |
|---|---|---|
Postfix queue before step 6 (postqueue -p on every node) |
diagnosis: are there notifications that were never delivered? | 31 notifications waiting, fencing included |
| Test of the SMTP target | message in Mailpit | message in Mailpit |
| Test of the Gotify target with the filtering proxy | diagnosis: the proxy log shows the refused request | error CONNECT proxy failed: 403; Proxying refused on filtered domain in the proxy log |
| Test of the Gotify target after the proxy exception | message in Gotify | message in Gotify |
postqueue -f with relayhost pointing to Mailpit |
empty queue on every node | empty queue, 31 messages delivered |
Failed backup (vzdump to a nonexistent storage) |
a notification on every target, severity error |
three targets, two copies in Mailpit, priority 9 in Gotify |
| Metrics in InfluxDB | the measurements sent by the nodes in the pve bucket |
measurements system, cpustat, memory, nics, blockstat, ballooninfo, proxmox-support |
| Grafana | data source test passed, dashboard with the three nodes | datasource is working. 1 buckets found; dashboard with the data of the three nodes |
logger on the nodes and restart of CT 101 |
one file per node and program in /var/log/remote/<node>/, times consistent with the nodes |
lines from all three nodes; times aligned after setting the time zone of CT 153 |
| Port 8086 from CT 101 (not a node), with the CT 153 firewall | blocked | blocked |
Port 8086 from desopve01, Grafana from the management network, logs after the firewall |
allowed | allowed |
Final lab state
Section titled “Final lab state”- Notifications (
/etc/pve/notifications.cfg):- targets
mail-to-root(sendmail, default),mailpit(SMTP to 172.27.199.151:1025) andgotify(http://172.27.199.152, token in/etc/pve/priv/notifications.cfg); - matchers
default-matcher(everything tomail-to-root),tutto-a-mailpit(everything tomailpit),critici-push(errors or fencing togotify).
- targets
- Postfix on nodes 01-03:
relayhost = [172.27.199.151]:1025, empty queue. - Lab proxy: the internal destinations
172.27.199.0/24and*.proxmox.communityare allowed as well. - CT 151
mailpitondesopve03, running (OCI image, 172.27.199.151, SMTP 1025, web 8025). The messages are kept in memory: they are lost when the container restarts. - CT 152
gotifyondesopve03, running (OCI image, 172.27.199.152, useradmin, application “Proxmox VE”). - CT 153
monitorondesopve03, running (Debian 13, 172.27.199.153, time zoneEurope/Rome): InfluxDB 2.9 (organizationproxmox, bucketpve, 30 days, tokenspve-scritturaandgrafana-lettura), Grafana 13.3 (admin, dashboard “Proxmox Cluster [Flux]”), rsyslog listening on TCP 514; firewall enabled with the rules of step 9. - Metric server
influx-monitorin the Datacenter. - rsyslog installed on nodes 01-03 with
/etc/rsyslog.d/90-remoto.conf. - IPSet
nodi-pve(172.27.199.21-24) in the Datacenter firewall. - The OCI templates
axllent_mailpit_latest.tarandgotify_server_latest.tarremain oncephfs.
What you learned
Section titled “What you learned”- Checking that notifications actually leave the cluster. With the default configuration they depend on Postfix delivering to the address of
root@pam. If the domain has no reachable mail server, they wait in the queue with no visible error: after an installation, the first check ispostqueue -pon every node, and the fix is arelayhostor an SMTP target. - Choosing between the
sendmailand SMTP targets. The SMTP target does not depend on the local queue, but it has no queue of its own and does not retry;sendmailhands the message to Postfix, which retries. Using both, as in this lab, costs a duplicate when they deliver to the same mailbox. - Planning for the proxy. The Gotify target, and according to the source code the Webhook target too, goes through the Datacenter proxy even toward internal addresses: with a filtering proxy, plan an exception for the internal destinations. The SMTP target and the InfluxDB metric server connect directly.
- Designing matchers. A target receives a notification at most once, but two targets that deliver to the same mailbox produce two copies. A rule on a field such as
type=fencing, in modeany, catches that event whatever its severity. - Separating write and read access to the metrics. A write-only token for Proxmox VE and a read-only token for Grafana: whoever reads the dashboards cannot alter the data.
- Centralizing logs with reliable timestamps. Service logs live in the journal, operation logs in the tasks. When you forward them, use a format that carries the time zone or keep the server in the nodes’ time zone, and check the times against a known event, such as the start of a task encoded in its UPID. A disk-assisted queue rides out an outage of the server and an orderly restart, not a crash of the node.
- Protecting the monitoring services. Only the nodes write, only the management network reads.
References
Section titled “References”- Proxmox VE – Notifications: SMTP target (no queue or retries), Gotify target (Datacenter proxy), matchers (each target at most once), system mail forwarding
- Proxmox – source code of the Gotify target (proxy, priority from the severity) and of the Webhook target (proxy)
- Proxmox VE – External Metric Server
- Postfix –
relayhost(square brackets) andmaximal_queue_lifetime - RFC 5321, section 5.1 – delivery without an MX record (implicit MX)
- InfluxDB OSS v2 – Install
- Grafana – Install on Debian or Ubuntu
- Grafana – dashboard “Proxmox Cluster [Flux]”
- Mailpit and Gotify
- rsyslog – omfwd and its default template, reserved templates (
RSYSLOG_TraditionalForwardFormat,RSYSLOG_ForwardFormat), disk-assisted queues