

Lab 37 – Virtual disks and controllers: VirtIO SCSI and Block, cache, aio, discard and limits
Dependencies
Section titled “Dependencies”- Previous labs:
- Node and storage:
desopve04, standalone node, with thelocal-lvmstorage (thin poolpve/data), so that the tests do not weigh on the cluster. - Resources: the cloud image
debian-13-genericcloud-amd64.qcow2inlocal:importondesopve04, downloaded in Lab 19, and the DC’s SSH key (Lab 05). The image is used to create a VM with cloud-init (covered in depth in Lab 40). - Addresses: test VM 370 on 172.27.199.170.
- Credentials:
root/<lab-password>→ Appendix B.
Objectives
Section titled “Objectives”- A test VM with three disks on the same storage, one per controller (VirtIO SCSI, VirtIO Block, SATA), measured with the same script, and the ability to tell which differences exceed the run-to-run variability and which do not.
- For each of the five cache modes, knowing where the data is when the guest gets a write acknowledged, and checking it with the QEMU monitor and the node’s dirty memory.
- An Async IO and cache combination that keeps the VM from starting, recognized from its error message and fixed.
- Space returned to the thin pool with discard and fstrim, confirmed with
lvson the node, and the disk exposed to the guest as an SSD. - Bandwidth and IOPS limits applied to a running VM and confirmed with a measurement.
How it works
Section titled “How it works”A virtual disk goes through three layers:
guest: disk driver ──► virtual controller (SCSI / VirtIO Block / SATA)QEMU: blockdev ──► cache (node page cache yes/no, flush yes/no) ──► aio (io_uring / native / threads)node: volume on the storage (here an LVM thin LV)Controllers.
- VirtIO SCSI: a paravirtualized controller. With VirtIO SCSI single each disk gets its own controller and can have a dedicated IO thread. It supports discard, many disks and hotplug, and it is the recommended default.
- VirtIO Block: also paravirtualized, and simpler: one PCI device per disk (
/dev/vdX), with no SCSI layer. - SATA (and IDE): emulated controllers that every operating system recognizes without extra drivers. Each operation usually costs the QEMU process more, and they cannot have an IO thread: Proxmox VE offers that option only for VirtIO SCSI single and VirtIO Block. Use them to install systems that lack VirtIO drivers, or for compatibility.
IO thread. With iothread=1 the disk’s I/O runs in a dedicated thread instead of QEMU’s main thread. Several disks then work in parallel, and I/O does not slow down the management of the VM.
Cache. The cache mode decides whether QEMU uses the node’s page cache and how it handles flushes, the requests with which the guest asks for the data it has written to become stable:
| Mode | Node page cache | Guest flushes | What can be lost if the node crashes |
|---|---|---|---|
none (default) |
no (O_DIRECT) | honored | whatever the guest has not yet made durable with a flush, as with a physical disk that has a write cache |
writethrough |
yes, for reads only | not needed: a write is acknowledged only once it is on the storage | none of the acknowledged writes |
writeback |
yes | honored | the same as with none, but the data not yet flushed sits in the node’s RAM and can be much larger |
directsync |
no (O_DIRECT) | not needed: a write is acknowledged only once it is on the storage | none of the acknowledged writes |
unsafe |
yes | ignored | even data the guest believes is already safe |
Async IO.
io_uring: the default for most storage types, the modern asynchronous Linux interface.native: classic kernel AIO; it works only with O_DIRECT, that is withcache=noneordirectsync.threads: a pool of threads doing synchronous I/O, the most compatible option.
Discard. When the guest deletes data, it can tell the disk which blocks are now free (TRIM/UNMAP). With discard=on QEMU passes the request on to the storage, and a thin pool releases the space. With the default discard=ignore the guest believes it has freed the space, but the node never finds out.
Test environment and versions
Section titled “Test environment and versions”The results below come from a run carried out in November 2026 with the configuration described here. You need it to read them correctly: with other versions, options or hardware, the same commands give different numbers.
| Component | Configuration used |
|---|---|
| Proxmox VE | 9.2.26, kernel 7.0.14-28-pve (Lab 04); QEMU 11.1.3 (Lab 35) |
| Node | desopve04, a standalone node with 4 cores and 16 GB of RAM (Lab 01) |
| Storage | local-lvm: 14 GiB thin pool pve/data on the system disk of desopve04 (Lab 03, Lab 09), 23.7% full before the lab |
| Test VM | Debian 13 from the cloud image, 2 vCPUs of type host, 2 GiB of RAM; 4 GiB test disks: scsi1 (VirtIO SCSI single, iothread=1), virtio1 (VirtIO Block, iothread=1), sata1 (SATA, no IO thread) |
| Disk options | defaults (cache=none, aio=io_uring, discard=ignore) unless a section says otherwise |
| Tool | fio from the Debian 13 repositories (version not recorded in this lab; Lab 19, with the same image, has 3.39), with --direct=1 --ioengine=libaio, run through fiorun.sh |
| Test area | 2 GiB per disk, written before the measurements; runs of 12-20 seconds plus a 2-second ramp-up; one or two rounds per configuration |
The models of the node’s disks and controllers are redacted, as explained in the manual’s conventions: read the numbers as properties of this configuration.
What the test measures, and what it does not. It measures the full path as the guest sees it: driver, virtual controller, QEMU (cache and aio), the LVM thin pool and the node’s disk. It does not isolate the individual layers, so a high or low value does not tell you on its own which layer produced it. It measures a single VM and one disk at a time, and the activity of the node’s other guests during the run was not recorded. With one or two short rounds, a difference between two configurations only counts if it is larger than the spread between rounds of the same configuration. For scsi1 with the default options, sections 2-4 of this lab measured between 26,063 and 29,085 IOPS for random reads and between 8,247 and 14,864 IOPS for random writes.
Procedure
Section titled “Procedure”1. The test VM
Section titled “1. The test VM”A VM with the system disk and three 4 GiB disks on the same storage, each on a different controller:
qm create 370 --name disk-370 --memory 2048 --cores 2 --cpu host --ostype l26 \ --net0 virtio,bridge=vmbr0 --scsihw virtio-scsi-single \ --scsi0 local-lvm:0,import-from=local:import/debian-13-genericcloud-amd64.qcow2,iothread=1 \ --ide2 local-lvm:cloudinit --boot order=scsi0 \ --ipconfig0 ip=172.27.199.170/24,gw=172.27.199.1 --nameserver 172.27.199.20 \ --ciuser labuser --sshkeys /root/.ssh/authorized_keys --serial0 socket --vga serial0qm resize 370 scsi0 8Gqm set 370 --scsi1 local-lvm:4,iothread=1 --virtio1 local-lvm:4,iothread=1 --sata1 local-lvm:4qm start 370 WARNING: Sum of all thin volume sizes (36.00 GiB) exceeds the size of thin pool pve/data and the amount of free space in volume group (<6.13 GiB).scsi1: local-lvm:vm-370-disk-1,iothread=1,size=4Gvirtio1: local-lvm:vm-370-disk-3,iothread=1,size=4Gsata1: local-lvm:vm-370-disk-2,size=4GThe warning is the overprovisioning seen in Lab 09: the volumes add up to 36 GiB on a 14 GiB pool. During the lab only part of each disk is ever written, and the pool is checked with lvs.
In the guest:
NAME SIZE ROTA TRAN MODEL DISC-MAXsda 8G 1 QEMU HARDDISK 1Gsdb 4G 1 sata QEMU HARDDISK 2Gsdc 4G 1 QEMU HARDDISK 1Gvda 4G 1 virtio 2GROTA 1: every disk presents itself as a rotational disk.
The measurements run fio with O_DIRECT in the guest, on a 2 GiB area of each disk that is filled before the test. Each run lasts 12-20 seconds. They are driven by the script fiorun.sh, which you copy into the guest (for example with scp from the DC, which logs in with ssh [email protected]). It runs fio with --direct=1 --ioengine=libaio --size=2G --time_based --ramp_time=2 and prints one line per run:
IOPS: operations completed per second;MB/s: fio’s bandwidth (bw, in KiB/s) divided by 1024, so the value is in MiB/s, the unit used in this lab’s tables;lat mediaandp99: the mean and the 99th percentile of the completion latency (clat, from submitting an operation to its completion), in microseconds. They do not include the submission time; fio’s three latencies are explained in Lab 19;- with
--fsync=1the latency printed covers the write only: fio reports the time spent infsyncseparately, and the script does not print it.
Install fio in the guest through the lab proxy, configured as in Lab 36:
sudo apt-get install -y fio./fiorun.sh disk/by-id/scsi-0QEMU_QEMU_HARDDISK_drive-scsi1 r4k randread 4k 32 152. Controllers: VirtIO SCSI, VirtIO Block and SATA
Section titled “2. Controllers: VirtIO SCSI, VirtIO Block and SATA”Two consecutive rounds, with the default options:
== giro 1VirtIO-SCSI+iothread randread4k IOPS= 26867 MB/s= 105.0 lat media= 1161 us p99= 2998 usVirtIO-SCSI+iothread randwrite4k IOPS= 8247 MB/s= 32.2 lat media= 3865 us p99= 45351 usVirtIO-SCSI+iothread write1M IOPS= 284 MB/s= 284.9 lat media= 27874 us p99= 379585 usVirtIO-Block+iothread randread4k IOPS= 30766 MB/s= 120.2 lat media= 1014 us p99= 2736 usVirtIO-Block+iothread randwrite4k IOPS= 7546 MB/s= 29.5 lat media= 4220 us p99= 32637 usVirtIO-Block+iothread write1M IOPS= 563 MB/s= 563.1 lat media= 14024 us p99= 71827 usSATA randread4k IOPS= 8155 MB/s= 31.9 lat media= 3804 us p99= 6193 usSATA randwrite4k IOPS= 5767 MB/s= 22.5 lat media= 5436 us p99= 32375 usSATA write1M IOPS= 468 MB/s= 468.7 lat media= 17126 us p99= 114819 us== giro 2VirtIO-SCSI+iothread randread4k IOPS= 29085 MB/s= 113.6 lat media= 1072 us p99= 2671 usVirtIO-SCSI+iothread randwrite4k IOPS= 10540 MB/s= 41.2 lat media= 3007 us p99= 23200 usVirtIO-SCSI+iothread write1M IOPS= 652 MB/s= 652.1 lat media= 12245 us p99= 78119 usVirtIO-Block+iothread randread4k IOPS= 29454 MB/s= 115.1 lat media= 1060 us p99= 2736 usVirtIO-Block+iothread randwrite4k IOPS= 7146 MB/s= 27.9 lat media= 4451 us p99= 28705 usVirtIO-Block+iothread write1M IOPS= 628 MB/s= 628.9 lat media= 12534 us p99= 63701 usSATA randread4k IOPS= 7748 MB/s= 30.3 lat media= 4003 us p99= 6128 usSATA randwrite4k IOPS= 2646 MB/s= 10.3 lat media= 11972 us p99= 304087 usSATA write1M IOPS= 344 MB/s= 344.2 lat media= 22930 us p99= 214958 us| Controller (both rounds) | 4k random reads | 4k random writes | 1M sequential write |
|---|---|---|---|
| VirtIO SCSI + iothread | 26,900-29,100 IOPS | 8,200-10,500 IOPS | 285-652 MiB/s |
| VirtIO Block + iothread | 29,500-30,800 IOPS | 7,100-7,500 IOPS | 563-629 MiB/s |
| SATA | 7,700-8,200 IOPS | 2,600-5,800 IOPS | 344-469 MiB/s |
Each point below separates what the test measured from how we interpret it, and names the check that would confirm the interpretation.
- 4k random reads.
- Measured: VirtIO SCSI 26,867 and 29,085 IOPS, VirtIO Block 30,766 and 29,454, SATA 8,155 and 7,748. The mean completion latency is 1.0-1.2 ms for the two VirtIO controllers and 3.8-4.0 ms for SATA.
- Interpretation: the two VirtIO controllers overlap. SATA reaches 25-30% of their reads, at 3-4 times the latency. That is consistent with the cost of an emulated controller, but the SATA disk is also the only one without an IO thread, and the test cannot separate the two factors.
- How to check: repeat the run on
scsi1withiothread=0to see what the IO thread alone is worth; during the run,top -H -p $(cat /var/run/qemu-server/370.pid)on the node shows which QEMU threads are busy (vCPUs, IO thread, main thread).
- 4k random writes.
- Measured: VirtIO SCSI 8,247 and 10,540 IOPS, VirtIO Block 7,546 and 7,146, SATA 5,767 and 2,646.
- Interpretation: VirtIO SCSI is ahead of VirtIO Block in both rounds, but the same disk with the same options produced anywhere between 8,247 and 14,864 IOPS across sections 2-4, so the difference is not established. In the second round SATA drops by half (from 5,767 to 2,646 IOPS, with a p99 of 304 ms), and the test does not say why.
- How to check: more and longer rounds, changing the order of the disks; on the node,
iostat -x 1(from thesysstatpackage) during the run shows whether the physical disk is saturated (%util,w_await).
- 1M sequential writes.
- Measured: VirtIO SCSI 285 and 652 MiB/s, VirtIO Block 563 and 629, SATA 469 and 344.
- Interpretation: the gap between the two rounds on the same disk (more than double for VirtIO SCSI) is larger than the differences between controllers, so this test cannot rank them. Write caches in the node’s disk or controller and background writes are possible causes; the test does not isolate them.
- How to check: as in point 2, with a write long enough to exceed the caches.
In short: the only thing this test shows with confidence is that SATA falls far behind both VirtIO controllers for random reads. Between VirtIO SCSI and VirtIO Block, the differences seen in this lab are within the variability of the test.
3. Cache modes
Section titled “3. Cache modes”Hardware → Hard Disk → Edit, with Advanced enabled, shows all the disk options:
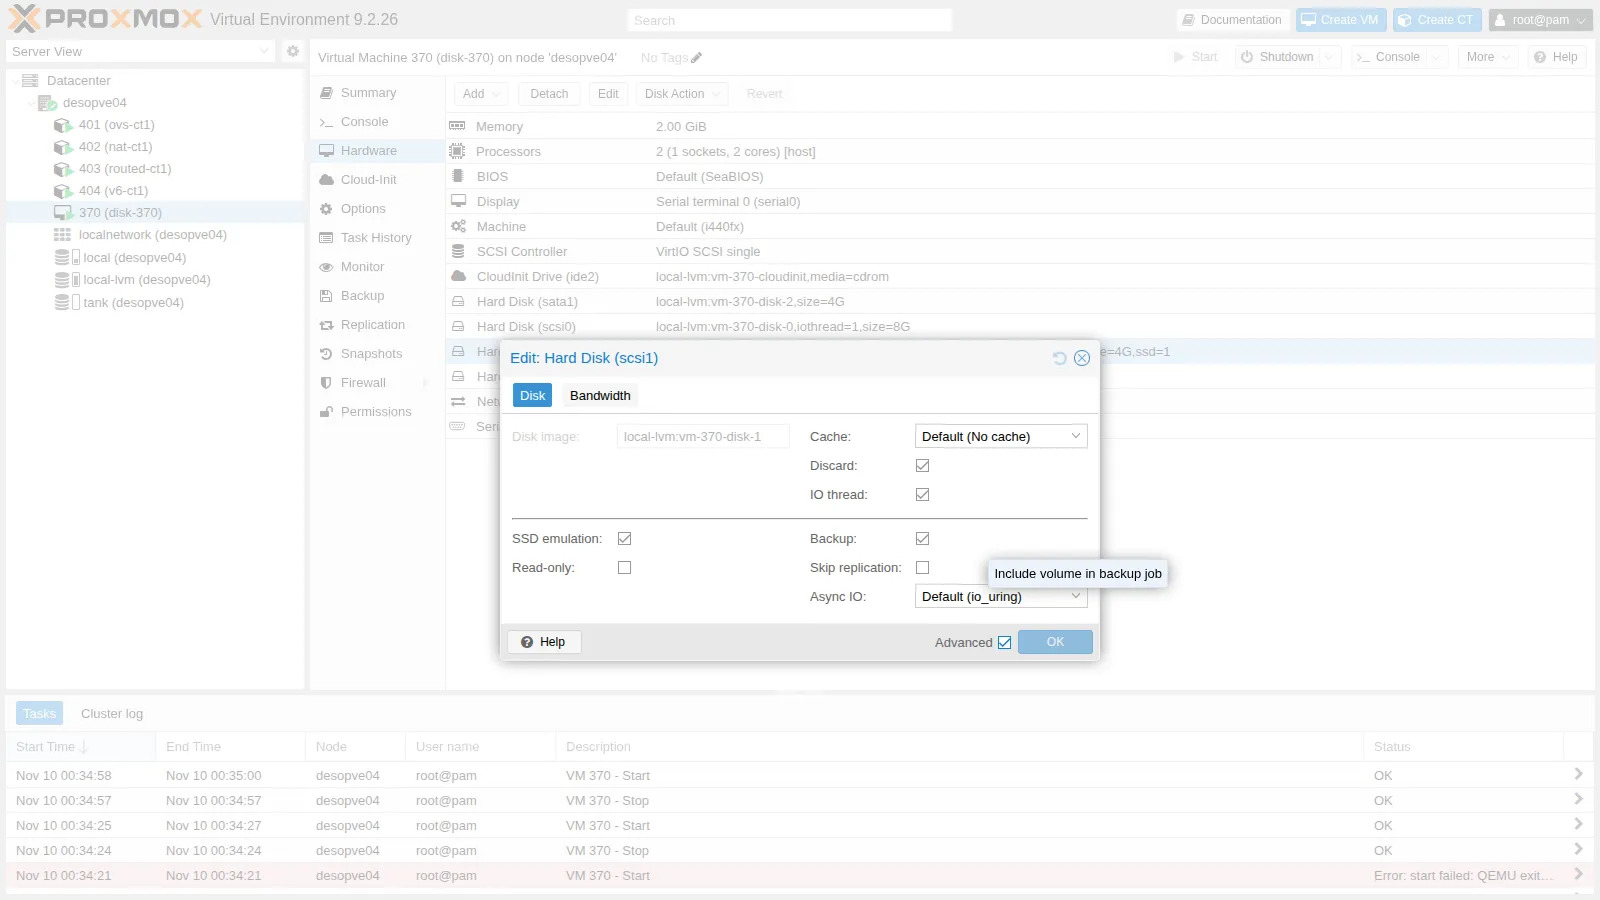
Test the five modes on scsi1. Every change requires stopping and starting the VM:
qm set 370 --scsi1 local-lvm:vm-370-disk-1,iothread=1,cache=writebackqm stop 370 && qm start 370Each mode gets four runs on /dev/disk/by-id/scsi-0QEMU_QEMU_HARDDISK_drive-scsi1. The first one writes one block at a time and follows every write with an fsync, the way a database commits transactions. In that line, IOPS counts write + fsync cycles per second.
== cache=nonefsync ogni scrittura QD1 IOPS= 545 MB/s= 2.1 lat media= 1418 us p99= 4014 usrandwrite 4k QD32 IOPS= 8693 MB/s= 34.0 lat media= 3654 us p99= 22938 usrandread 4k QD32 IOPS= 26063 MB/s= 101.8 lat media= 1200 us p99= 3097 uswrite 1M QD8 IOPS= 317 MB/s= 317.5 lat media= 24870 us p99= 160432 us== cache=writebackfsync ogni scrittura QD1 IOPS= 575 MB/s= 2.2 lat media= 182 us p99= 692 usrandwrite 4k QD32 IOPS= 30334 MB/s= 118.5 lat media= 1025 us p99= 1679 usrandread 4k QD32 IOPS= 32097 MB/s= 125.4 lat media= 971 us p99= 2867 uswrite 1M QD8 IOPS= 2508 MB/s= 2508.7 lat media= 3018 us p99= 9241 us== cache=writethroughfsync ogni scrittura QD1 IOPS= 501 MB/s= 2.0 lat media= 1901 us p99= 13042 usrandwrite 4k QD32 IOPS= 9728 MB/s= 38.0 lat media= 3366 us p99= 17695 usrandread 4k QD32 IOPS= 27700 MB/s= 108.2 lat media= 1129 us p99= 4686 uswrite 1M QD8 IOPS= 537 MB/s= 537.4 lat media= 15002 us p99= 56361 us== cache=directsyncfsync ogni scrittura QD1 IOPS= 717 MB/s= 2.8 lat media= 1315 us p99= 3686 usrandwrite 4k QD32 IOPS= 5583 MB/s= 21.8 lat media= 5725 us p99= 41157 usrandread 4k QD32 IOPS= 29685 MB/s= 116.0 lat media= 1054 us p99= 2966 uswrite 1M QD8 IOPS= 430 MB/s= 430.6 lat media= 18228 us p99= 57934 us== cache=unsafefsync ogni scrittura QD1 IOPS= 4399 MB/s= 17.2 lat media= 101 us p99= 387 usrandwrite 4k QD32 IOPS= 30261 MB/s= 118.2 lat media= 1028 us p99= 1876 usrandread 4k QD32 IOPS= 30653 MB/s= 119.7 lat media= 1015 us p99= 2310 uswrite 1M QD8 IOPS= 2386 MB/s= 2386.9 lat media= 3172 us p99= 9241 us| Cache | Write + fsync, QD1 (cycles per second) | 4k random writes QD32 | 1M sequential write QD8 |
|---|---|---|---|
none |
545 | 8,700 IOPS | 318 MiB/s |
writethrough |
501 | 9,700 IOPS | 537 MiB/s |
directsync |
717 | 5,600 IOPS | 431 MiB/s |
writeback |
575 | 30,300 IOPS | 2,509 MiB/s |
unsafe |
4,399 | 30,300 IOPS | 2,387 MiB/s |
writebackandunsafewithoutfsync.- Measured: 1M sequential writes reach 2,509 MiB/s with
writebackand 2,387 withunsafe, against 318-537 MiB/s for the other three modes; 4k random writes at QD32 reach about 30,300 IOPS, against 5,583-9,728. - Interpretation: consistent with the writes being absorbed by the node’s page cache, which these two modes use for writes as well: the guest gets its acknowledgment before the data reaches the disk. The dirty-memory test further down points the same way.
- How to check: during the run, on the node, read
grep -E '^(Dirty|Writeback):' /proc/meminfoevery second and watch the physical disk withiostat -x 1. If the guest writes at 2.5 GiB/s while the disk keeps writing at its usual pace, the difference is sitting in RAM.
- Measured: 1M sequential writes reach 2,509 MiB/s with
- One write at a time, each followed by
fsync.- Measured:
nonecompletes 545 cycles per second,writethrough501,directsync717,writeback575 andunsafe4,399. The latency printed covers the write alone: 182 µs withwriteback, 101 µs withunsafe, 1,315-1,901 µs with the other three. - Interpretation: with
writebackthe write completes in RAM (182 µs), yet each cycle takes about 1.7 ms (1/575 of a second), close to the 1.8 ms ofnone. The extra time is spent outside the write, which is consistent with anfsyncthat waits for the node to put the data on disk. Withunsafethe node completes almost eight times as many cycles, consistent with flushes being ignored, as the monitor confirms below. Withwritethroughanddirectsyncthe write takes up nearly the whole cycle, because it is already synchronous. - How to check: fio measures the time spent in
fsyncseparately (jobs[0].sync.lat_nsin the JSON output, which the script does not print); on the node,iostat -x 1shows the flush requests per second that reach the disk (thef/scolumn).
- Measured:
- The other measurements.
- Measured:
none,writethroughanddirectsyncgive 5,583-9,728 IOPS for random writes and 318-537 MiB/s for sequential writes. Random reads land between 26,063 and 32,097 IOPS in all five modes. - Interpretation: these differences are of the same order as the spread measured for an unchanged configuration (see Test environment and versions), so the test neither ranks these three modes nor shows any effect of the cache on reads. Nor does it tell what limits the reads: the disk, the thin pool, QEMU or the guest’s two vCPUs.
- How to check: run
iostat -x 1on the node during the read test. If the physical disk serves reads at the same rate, they reach the disk; if it is nearly idle, they come from a cache.
- Measured:
The monitor shows the configuration actually in use: with unsafe on scsi1, that disk’s nodes report writeback, ignore flushes (only the Cache mode lines are shown here):
info block -n Cache mode: writeback Cache mode: writeback, ignore flushes Cache mode: writeback, ignore flushesWhere the data is when the guest believes it has been written. In the guest, write 1 GiB straight to the disk, ending with an fsync (conv=fsync). Right afterwards, look at the node’s dirty memory, that is the data still waiting to be written to disk:
dd if=/dev/urandom of=/dev/disk/by-id/scsi-0QEMU_QEMU_HARDDISK_drive-scsi1 bs=1M count=1024 oflag=direct conv=fsync # in the guestgrep ^Dirty: /proc/meminfo # on the node== cache=writeback1073741824 bytes (1.1 GB, 1.0 GiB) copied, 6.10631 s, 176 MB/s nodo subito dopo: Dirty: 1456 kB== cache=unsafe1073741824 bytes (1.1 GB, 1.0 GiB) copied, 4.60421 s, 233 MB/s nodo subito dopo: Dirty: 1050036 kB- Measured: right after the
dd, which ends with anfsync, the node’sDirtycounter reads 1,456 kB withwritebackand 1,050,036 kB withunsafe, roughly the GiB that was just written. - Interpretation: with
writeback, the guest’sfsyncforced the node to write the data out of its page cache, which is consistent with the data already being on the node’s disk whenfsyncreturns. Withunsafe, the GiB the guest considers safe was still in the node’s RAM: a power failure at that moment would wipe it out, and the guest would never know. - Limits of the test:
Dirtycounts all the dirty memory of the node, and it was read only once. Theddthroughput (176 and 233 MB/s) is not a storage measurement here: it includes generating random data with/dev/urandomin the guest, and it issues one 1 MiB write at a time. - How to check: read
DirtyandWritebackevery second for a minute after thedd. Withunsafethey should fall as the node’s kernel writes the data out, within the interval set byvm.dirty_expire_centisecs.
Which mode to choose. unsafe is only for throwaway data, for example while installing a system that will become a template. writeback makes sense when the guest uses flushes correctly and the node’s RAM is protected against power loss (a UPS), because the amount of data the guest has not yet flushed can be large. The default, none, is the safe choice.
4. Async IO
Section titled “4. Async IO”scsi1 with cache=none, two rounds per mode:
== aio=io_uringrandread 4k QD32 IOPS= 27460 MB/s= 107.3 lat media= 1137 us p99= 3064 usrandwrite 4k QD32 IOPS= 13340 MB/s= 52.1 lat media= 2385 us p99= 13959 usrandread 4k QD32 IOPS= 27121 MB/s= 106.0 lat media= 1155 us p99= 3293 usrandwrite 4k QD32 IOPS= 14864 MB/s= 58.1 lat media= 2179 us p99= 11600 us== aio=nativerandread 4k QD32 IOPS= 32438 MB/s= 126.7 lat media= 967 us p99= 2933 usrandwrite 4k QD32 IOPS= 6043 MB/s= 23.6 lat media= 5268 us p99= 50594 usrandread 4k QD32 IOPS= 33112 MB/s= 129.4 lat media= 948 us p99= 3031 usrandwrite 4k QD32 IOPS= 12222 MB/s= 47.8 lat media= 2594 us p99= 16908 us== aio=threadsrandread 4k QD32 IOPS= 31479 MB/s= 123.0 lat media= 996 us p99= 2769 usrandwrite 4k QD32 IOPS= 6368 MB/s= 24.9 lat media= 4995 us p99= 31326 usrandread 4k QD32 IOPS= 30716 MB/s= 120.0 lat media= 1021 us p99= 3064 usrandwrite 4k QD32 IOPS= 7674 MB/s= 30.0 lat media= 4142 us p99= 57410 us- Reads.
- Measured:
io_uring27,460 and 27,121 IOPS,native32,438 and 33,112,threads31,479 and 30,716. - Interpretation:
nativeandthreadsbeatio_uringin both rounds, by 13-22%, and they also beat every read measured onscsi1with the default options (26,063-29,085 IOPS). That hints at an advantage for random reads in this configuration, but it is not proof: the modes were measured one after another, with only two rounds each. - How to check: more rounds that alternate the modes (
io_uring,native,threads, thenio_uringagain), each after restarting the VM, and longer runs.
- Measured:
- Writes.
- Measured:
io_uring13,340 and 14,864 IOPS,native6,043 and 12,222,threads6,368 and 7,674. - Interpretation: the same
io_uringconfiguration produced 8,247-10,540 IOPS in section 2 and 8,693 in section 3, andnativedoubles from one round to the next. The spread of an unchanged configuration covers the differences between modes, so this test names no winner for writes. - How to check: as in point 1.
- Measured:
Which mode to choose. io_uring remains the sensible default for this storage until a repeated measurement on your own storage shows a consistent advantage for another mode. threads is meant for storage types with which the other modes cause problems: for some of them, such as thick LVM and CIFS, Proxmox VE does not use io_uring even as the default. qm showcmd 370 --pretty shows the mode a disk actually uses.
A combination that prevents startup
Section titled “A combination that prevents startup”Configuration tried. aio=native with cache=writeback on scsi1:
qm stop 370qm set 370 --scsi1 local-lvm:vm-370-disk-1,iothread=1,aio=native,cache=writebackqm start 370Error observed. qm set accepts the configuration, but the start fails:
kvm: -blockdev {...,"file":{"aio":"native","cache":{"direct":false,"no-flush":false},...,"driver":"host_device","filename":"/dev/pve/vm-370-disk-1",...}: aio=native was specified, but it requires cache.direct=on, which was not specified.start failed: QEMU exited with code 1The message states the constraint: native needs cache.direct=on, that is O_DIRECT, which among the Proxmox VE cache modes only none and directsync provide. In this version (Proxmox VE 9.2.26 with QEMU 11.1.3) the combination is not rejected when the configuration is saved, only when the VM starts.
Decision. Go back to a valid combination before moving on; here, the defaults, by removing aio and cache from the disk line.
qm set 370 --scsi1 local-lvm:vm-370-disk-1,iothread=1qm start 370Result. The VM starts again with cache=none and aio=io_uring, and the next section starts from this configuration.
5. Discard, fstrim and SSD emulation
Section titled “5. Discard, fstrim and SSD emulation”Create an ext4 filesystem on scsi1, write a 1 GiB file, delete it and ask the guest to report the free blocks with fstrim. On the node, watch how much of the thin volume is in use:
# in the guestD=/dev/disk/by-id/scsi-0QEMU_QEMU_HARDDISK_drive-scsi1sudo mkfs.ext4 -F $D && sudo mkdir -p /mnt/t && sudo mount $D /mnt/tsudo dd if=/dev/urandom of=/mnt/t/prova bs=1M count=1024 conv=fsyncsudo rm /mnt/t/prova && sudo fstrim -v /mnt/t# on the node, before and afterlvs pve/vm-370-disk-1With the default discard=ignore:
vm-370-disk-1 50.00 ← before (area filled for the tests)file-1GiB-scritto vm-370-disk-1 50.79/mnt/t: 2.9 GiB (3068858368 bytes) trimmed vm-370-disk-1 50.79 ← after fstrim: no changeThe guest reports 2.9 GiB freed, but the volume stays at 50.79%: with discard=ignore, QEMU does not pass the requests on to the storage.
With discard=on and ssd=1 (stopping and starting the VM):
qm set 370 --scsi1 local-lvm:vm-370-disk-1,iothread=1,discard=on,ssd=1sdb rotational=0/mnt/t: 3.9 GiB (4142604288 bytes) trimmed vm-370-disk-1 3.46 ← the volume returns 1.9 GiB to the poolfile-1GiB-scritto vm-370-disk-1 28.46/mnt/t: 6 MiB (6283264 bytes) trimmed vm-370-disk-1 28.46 ← fstrim run right after rm/mnt/t: 1.1 GiB (1197453312 bytes) trimmed vm-370-disk-1 3.46 ← fstrim after sync and a few seconds data 65.69 ← thin pool of the node: it was at 79%ssd=1: the guest sees a non-rotational disk (rotational=0). What changes as a result depends on the guest’s operating system and applications, and this test does not measure it. According to the Proxmox VE documentation, some operating systems also need SSD emulation before they send TRIM. SSD emulation is not available on VirtIO Block disks.discard=on: the space freed in the guest goes back to the thin pool. The volume drops from 50.79% to 3.46% (1.9 GiB returned), and the node’s thin pool from 79% to 65.69%.- Trimming right after
rm: it frees only 6 MiB, while aftersyncand a few seconds it frees 1.1 GiB. That is consistent with ext4 making the blocks of a deleted file available only when the journal commits, every 5 seconds by default. To check it, repeat the test withsyncimmediately beforefstrimand no wait. Either way, Debian runsfstrimevery week throughfstrim.timer, which isenabledin the guest, so the space comes back without any intervention.
On thin storage (LVM-thin, ZFS, Ceph, qcow2), without discard=on the space freed inside the guest stays allocated on the node, as you saw here with discard=ignore. Lab 09 shows the same mechanism for containers (pct fstrim). When a thin pool fills up faster than the guests’ data would justify, this is one of the first things to check: compare the space used inside the guest (df) with the usage of the volume on the node (lvs).
6. Bandwidth and IOPS limits
Section titled “6. Bandwidth and IOPS limits”The Bandwidth tab of the same window limits reads and writes, in MB/s and in operations per second, with an optional temporary burst:
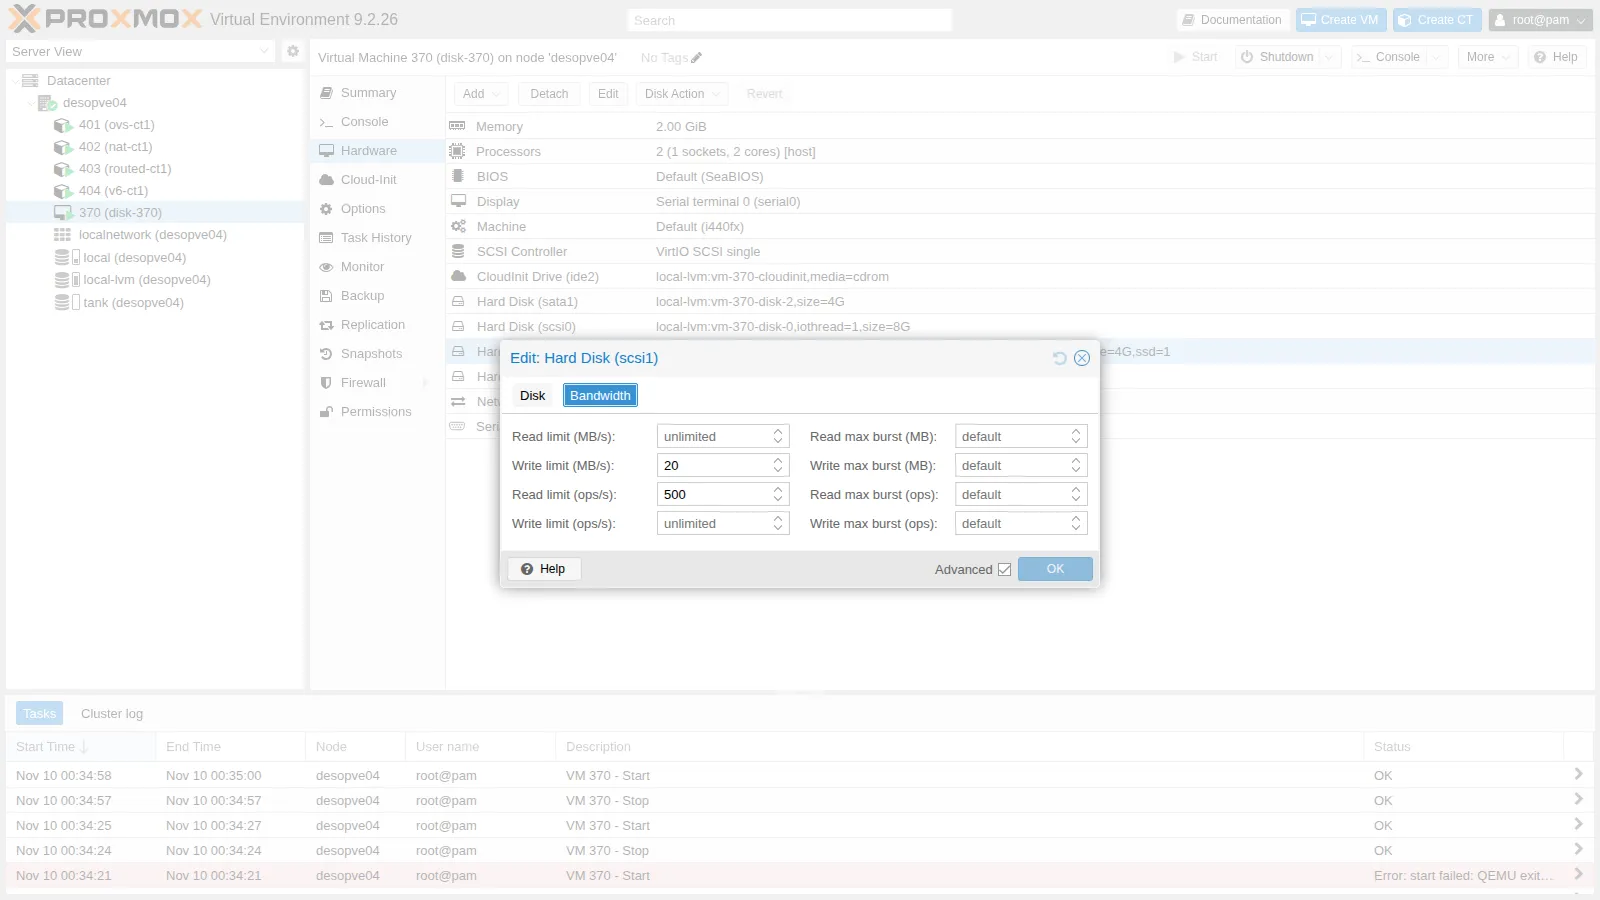
The limits are applied live, without restarting the VM:
qm set 370 --scsi1 local-lvm:vm-370-disk-1,iothread=1,discard=on,ssd=1,mbps_wr=20,iops_rd=500== senza limitiwrite 1M QD8 IOPS= 723 MB/s= 724.0 lat media= 10849 us p99= 67633 usrandread 4k QD32 IOPS= 27229 MB/s= 106.4 lat media= 1148 us p99= 3031 usupdate VM 370: -scsi1 local-lvm:vm-370-disk-1,iothread=1,discard=on,ssd=1,mbps_wr=20,iops_rd=500status: running== con limiti (applicati a caldo)write 1M QD8 IOPS= 19 MB/s= 20.0 lat media= 403898 us p99= 599785 usrandread 4k QD32 IOPS= 497 MB/s= 2.0 lat media= 64070 us p99= 66322 us- Measured: with the limits in place, 1M writes at QD8 run at 20.0 MiB/s with a mean completion latency of 404 ms (p99 600 ms), and 4k reads at QD32 reach 497 IOPS with a 64 ms mean. Without limits they were 724 MiB/s and 27,229 IOPS.
fioreported no errors. - Interpretation: the limits hold. Proxmox VE converts
mbps_wr=20into 20 × 1024 × 1024 bytes per second, that is 20 MiB/s, the same unit the script prints; the read limit was 500 operations per second. The latencies are what a queue predicts: at a fixed throughput, latency is roughly the queue depth divided by the rate, so 8 / 20 per second = 0.40 s and 32 / 497 per second ≈ 64 ms. The guest therefore gets no errors: its requests wait in the queue. - How to check:
qm showcmd 370 --prettyshows the limit in bytes per second (bps-write20971520).
This keeps a noisy VM from saturating storage it shares with others; CPU limits and the rest are covered in Lab 42.
Verification and tests
Section titled “Verification and tests”The lab has succeeded when every section has produced the fiorun.sh lines for all disks and modes, and the checks below give the expected result. The observed values are those of the run described in Test environment and versions.
| Check | Expected result | Observed in this run |
|---|---|---|
| Disk names in the guest | tests use /dev/disk/by-id, never sdX |
sdb and sdc swapped after a restart; tests run on drive-scsi1 |
| Controllers | every difference compared with the spread between the two rounds | SATA at 25-30% of VirtIO for random reads; VirtIO SCSI and Block indistinguishable |
unsafe cache |
ignore flushes in the monitor; data still in Dirty on the node after a guest fsync |
writeback, ignore flushes; Dirty 1,050,036 kB (1,456 kB with writeback) |
aio=native with cache=writeback |
the VM does not start; with a valid combination it starts again | error requires cache.direct=on; VM restarted with the default options |
| Discard | with discard=on, the guest’s fstrim lowers the volume usage; with ignore, it does not |
from 50.79% to 3.46% with on; unchanged with ignore |
| I/O limits | applied to the running VM, measurement close to the limit, no errors in the guest | 20.0 MiB/s and 497 IOPS; mean latencies 404 ms and 64 ms |
Final lab state
Section titled “Final lab state”- VM 370
disk-370: deleted along with its four disks (qm stop 370 && qm destroy 370 --purge). - Thin pool
pve/dataondesopve04: back to 23.7%, as before the lab. - No changes to the cluster nodes.
What you learned
Section titled “What you learned”- Choosing a disk controller: VirtIO SCSI single with an IO thread as the default, or VirtIO Block, which this test could not tell apart from it; SATA only until the guest has VirtIO drivers, since it delivered 25-30% of the VirtIO random reads.
- Choosing a cache mode by where acknowledged data may sit:
noneby default;writebackonly if the guest uses flushes and the node’s RAM is protected against power loss;unsafeonly for throwaway data. The monitor (info block) and the node’sDirtycounter show what actually happens. - Leaving
aioat its default until a repeated measurement on your own storage shows a consistent advantage, and usingnativeonly withcache=noneordirectsync, or the VM will not start. - Enabling
discard=onon thin storage, and making sure something in the guest sends the trims (fstrim.timer), by comparing the space used in the guest withlvson the node. - Using I/O limits to protect shared storage, knowing that the guest experiences them as latency (queue depth divided by the limit), not as errors.
- Reading a performance comparison: before attributing a difference to the option you changed, compare it with the spread between repeated runs of the same configuration.
- Identifying disks in the guests by
/dev/disk/by-id, not bysdX.
References
Section titled “References”- Proxmox VE – VM hard disks: cache, discard, IO thread, SSD emulation
- Proxmox VE wiki – Performance Tweaks: disk cache modes
- QEMU 11.1 – Block device options (
-drive: cache, aio, discard, detect-zeroes) - fio – interpreting the output: slat, clat and lat
proc_meminfo(5)– theDirtyandWritebackcounters