

Lab 19 – Comparative storage benchmark with fio
Dependencies
Section titled “Dependencies”- Previous labs: the storages to compare must exist:
- Free space: 8 GiB on each of these storages; 3 GiB on
local-zfsandlocal-lvmfor the system disks of the two test VMs. - Internet: the lab proxy must allow
cloud.debian.org(with its mirror*.acc.umu.se) anddeb.debian.org. - Credentials:
root/<lab-password>on the nodes → Appendix B. To log in to the test VMs you use an SSH key created for the occasion (step 1).
Objectives
Section titled “Objectives”- Produce a comparable table of IOPS, bandwidth and latency for six different storages, measured with the same workload, the same VM and the same method.
- For every number, be able to say which part of the I/O path may have shaped it (caches, never-written blocks, how writes are acknowledged) and which check would confirm it.
- Have two repeatable scripts,
bench.shandriassunto.py, to run the same measurement on another system.
How it works
Section titled “How it works”The three measurements
Section titled “The three measurements”| Measurement | What it tells you | Typical test |
|---|---|---|
| IOPS | operations per second | small blocks (4 KiB) at random offsets: databases, operating systems |
| Bandwidth (MB/s) | data per second | large blocks (1 MiB) in sequence: backups, copies, video |
| Latency (ms) | how long a single operation waits | one operation at a time (QD1) |
The queue depth (QD) is the number of operations in flight at the same time. At QD32 the storage can work on many of them in parallel, so IOPS go up. At QD1 each operation waits for the previous one, so you measure the response time of a single operation: what an application feels when it writes and waits for the acknowledgment.
fio reports three different latencies. slat is the submission latency. clat (completion latency) is the time from submitting an operation to its completion. lat is the total latency and includes both. Every table in this lab states which one it shows.
Three benchmark pitfalls
Section titled “Three benchmark pitfalls”-
Caches. Several cache layers sit between the VM and the disk:
- the page cache of the guest operating system, which
fio --direct=1bypasses; - the QEMU cache, which is not used when the disk is set to
cache=none, the Proxmox default; - the ZFS ARC on the node or on the NAS. Depending on the ZFS version and on the properties of the dataset or zvol (
primarycache,direct), it may serve reads from RAM even when the VM uses--direct=1.
A read served from RAM can reach tens of thousands of IOPS even when the disk underneath is slow.
- the page cache of the guest operating system, which
-
Never-written blocks. On thin storage (ZFS, LVM-thin, Ceph), reading a block that was never written usually never reaches the disk: the storage answers with zeros. Before measuring reads, fill the test area first (preconditioning).
-
Writes acknowledged from RAM. Many storages acknowledge a write as soon as it is in memory and flush it to disk later, unless the system explicitly asks for an
fsync. Plain writes and writes followed byfsynccost very different amounts of time, so measure both.
Method
Section titled “Method”- Same VM, same jobs: a Debian 13 VM with one 8 GiB disk per storage, all on
VirtIO SCSI singlewithiothread=1andcache=none. The cluster needs one VM (bench01);local-lvmandtanklive ondesopve04, so they need a second, identical VM (bench04). - Raw device: fio writes straight to
/dev/disk/by-id/..., with no file system, using--direct=1andlibaio. - Preconditioning: before the tests, the whole test area of each disk (2 GiB) is written once.
- Five 20-second jobs (plus a 3-second ramp-up), each run twice. The table shows the average and, in parentheses, how far apart the two runs are.
- One extra job with an
fsyncafter every write, to measure the cost of a write that has to reach stable storage. - Only one storage is tested at a time, never several in parallel.
Test environment and versions
Section titled “Test environment and versions”The results further down come from a run carried out in November 2026 with the configuration below. You need it to read them correctly: with different versions, options or hardware, the same jobs give different numbers.
| Component | Configuration used |
|---|---|
| Proxmox VE | 9.2.26, kernel 7.0.14-28-pve (Lab 04) |
| Test VM | Debian 13 from the cloud image, 2 vCPUs of type host, 2 GiB of RAM, fio 3.39 |
| VM disks | VirtIO SCSI single, iothread=1, cache=none, aio left at its default, which depends on the storage (see below), no discard; raw 8 GiB devices with a 2 GiB test area |
local-zfs |
ZFS mirror on the two system disks of desopve01 (Lab 03), ARC with the limit set by the installer |
local-lvm |
LVM-thin on the system disk of desopve04 (Lab 03, Lab 09) |
tank |
ZFS RAIDZ1 on the four 20 GB disks of desopve04, plus a hot spare; ARC capped at 2 GiB (Lab 10) |
nas-nfs |
NFS 4.2 to the dati/nfs dataset of the TrueNAS SCALE 25.10 NAS, on a mirrored ZFS pool (Lab 12, Lab 13); VM disk in raw format |
nas-lvm |
Shared LVM on a 40 GiB iSCSI zvol of the same NAS, over two multipath paths (Lab 15) |
rbd-vm |
Ceph 20.2 (tentacle), replicated pool size 3 / min_size 2 on seven OSDs across nodes 01-03, public and cluster networks on dedicated VLANs (Lab 17, Lab 18) |
| Network | MTU 1500 on every link (Lab 21) |
Disk and controller models are redacted, as explained in the manual’s conventions: read the numbers as properties of this configuration, not of a particular disk model.
The aio mode is not the same on every disk. The disks were created without the aio option, so the qemu-server default applies, and qemu-server picks it per storage type (functions storage_allows_io_uring_default and aio_cmdline_option in the source, see the references):
io_uringonlocal-zfs,local-lvm,tankandnas-nfs;nativeonnas-lvm: on plain LVM storages (typelvm) Proxmox VE does not useio_uringby default, and withcache=noneit falls back tonative;- no
aiomode onrbd-vm: withkrbd 0(Lab 17) QEMU reaches the image through librbd, and qemu-server setsaioonly for files and block devices.
This list comes from the source code, not from the run, which did not record the command line of the VMs. qm showcmd 190 --pretty shows the mode each disk actually uses, as "aio":… in its -blockdev line.
What the test measures, and what it does not. It measures the full path as a VM sees it: the guest kernel, the virtual controller, QEMU, the Proxmox storage layer and, for network storages, the network plus the NAS or the OSDs. It does not isolate the individual layers, so a high or low value does not tell you on its own which layer produced it. It does not measure many VMs working in parallel. With a 2 GiB test area, smaller than the RAM of the nodes and of the NAS, caches can affect the reads. Two 20-second runs give an idea of the variability, not a statistic.
Procedure
Section titled “Procedure”1. The test VMs from a cloud image
Section titled “1. The test VMs from a cloud image”Instead of installing Debian from the ISO, use the official cloud image: a ready-made disk that configures itself at first boot with cloud-init (cloud-init and templates are the subject of lab 40).
-
On
desopve01and ondesopve04create an SSH key without a passphrase, used only to log in to the two test VMs (you will delete it at the end):root@desopve01 ssh-keygen -q -t ed25519 -N '' -f /root/benchroot@desopve04 ssh-keygen -q -t ed25519 -N '' -f /root/benchThen download the image into the
localstorage (content import) ofdesopve01and ofdesopve04. The Debian site redirects to a mirror, so you need-L:root@desopve01 curl -sL -x http://proxy.proxmox.community:3128 \-o /var/lib/vz/import/debian-13-genericcloud-amd64.qcow2 \https://cloud.debian.org/images/cloud/trixie/latest/debian-13-genericcloud-amd64.qcow2qemu-img info /var/lib/vz/import/debian-13-genericcloud-amd64.qcow2 | grep -E "format|virtual"Output file format: qcow2virtual size: 3 GiB (3221225472 bytes)root@desopve04 curl -sL -x http://proxy.proxmox.community:3128 \-o /var/lib/vz/import/debian-13-genericcloud-amd64.qcow2 \https://cloud.debian.org/images/cloud/trixie/latest/debian-13-genericcloud-amd64.qcow2 -
Create
bench01ondesopve01. The system disk is imported from the image (import-from); cloud-init sets up the user, the SSH key and the network. Then add an 8 GiB disk for each storage to measure:root@desopve01 qm create 190 --name bench01 --memory 2048 --cores 2 --cpu host \--scsihw virtio-scsi-single --net0 virtio,bridge=vmbr0 --boot order=scsi0 \--serial0 socket --vga serial0 \--scsi0 local-zfs:0,import-from=local:import/debian-13-genericcloud-amd64.qcow2,iothread=1 \--ide2 local-zfs:cloudinit --ciuser labuser --sshkeys /root/bench.pub \--ipconfig0 ip=172.27.199.190/24,gw=172.27.199.1 \--nameserver 172.27.199.20 --searchdomain proxmox.communityqm set 190 --scsi1 local-zfs:8,iothread=1 --scsi2 nas-nfs:8,format=raw,iothread=1 \--scsi3 nas-lvm:8,iothread=1 --scsi4 rbd-vm:8,iothread=1qm start 190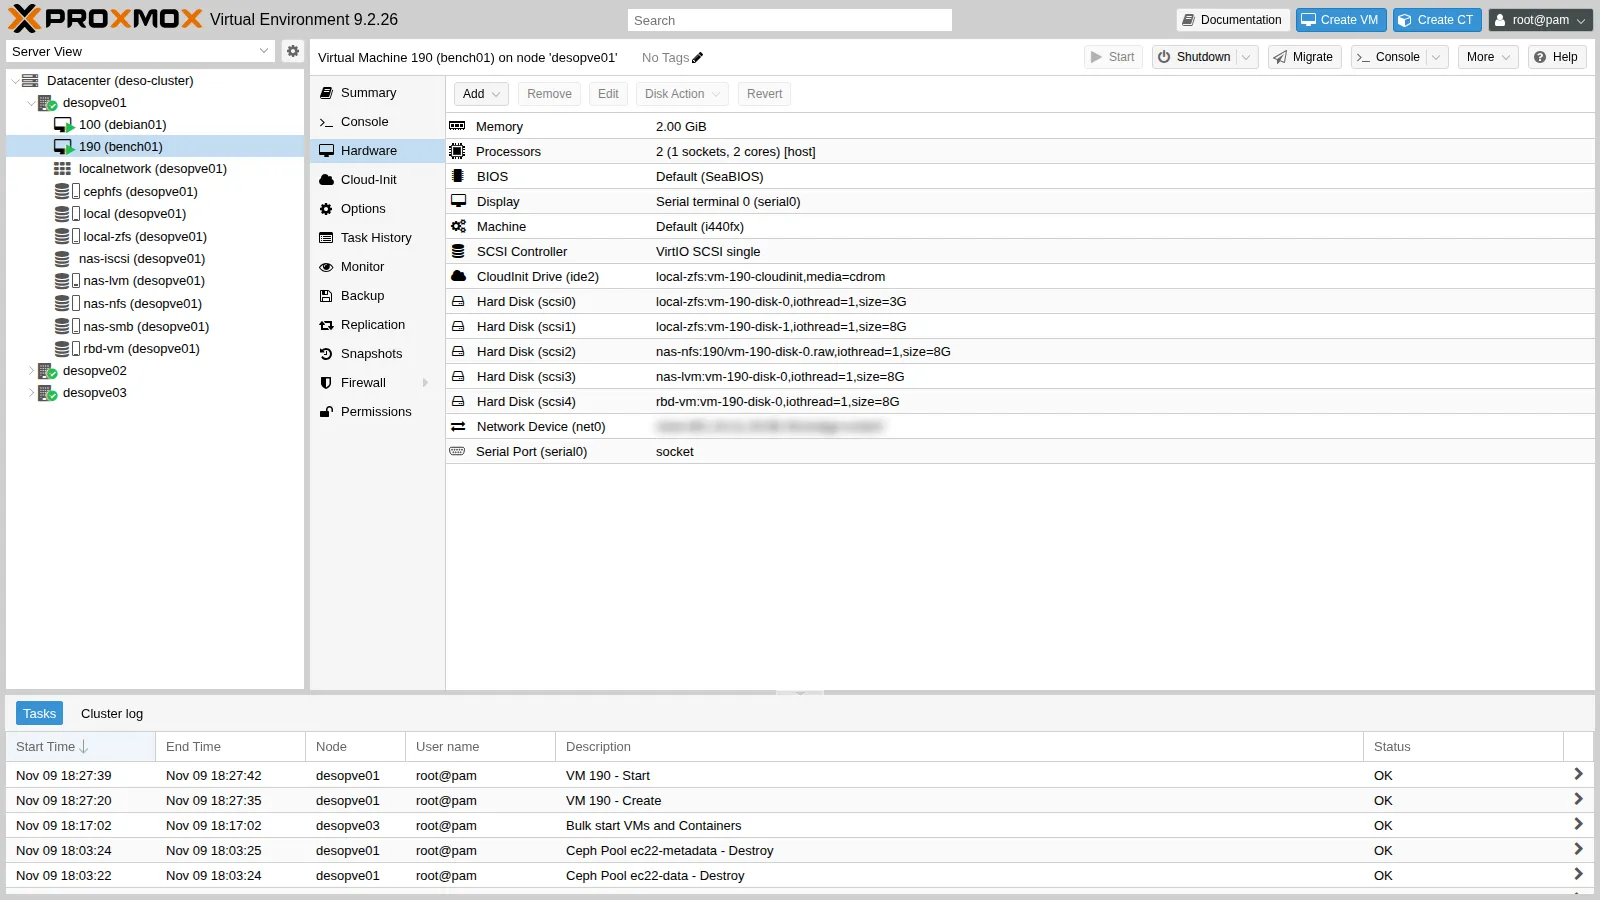
bench04(VMID 191, 172.27.199.191) is identical, ondesopve04, with the system disk onlocal-lvmand the test disks onlocal-lvmandtank:root@desopve04 qm create 191 --name bench04 --memory 2048 --cores 2 --cpu host \--scsihw virtio-scsi-single --net0 virtio,bridge=vmbr0 --boot order=scsi0 \--serial0 socket --vga serial0 \--scsi0 local-lvm:0,import-from=local:import/debian-13-genericcloud-amd64.qcow2,iothread=1 \--ide2 local-lvm:cloudinit --ciuser labuser --sshkeys /root/bench.pub \--ipconfig0 ip=172.27.199.191/24,gw=172.27.199.1 \--nameserver 172.27.199.20 --searchdomain proxmox.communityqm set 191 --scsi1 local-lvm:8,iothread=1 --scsi2 tank:8,iothread=1qm start 191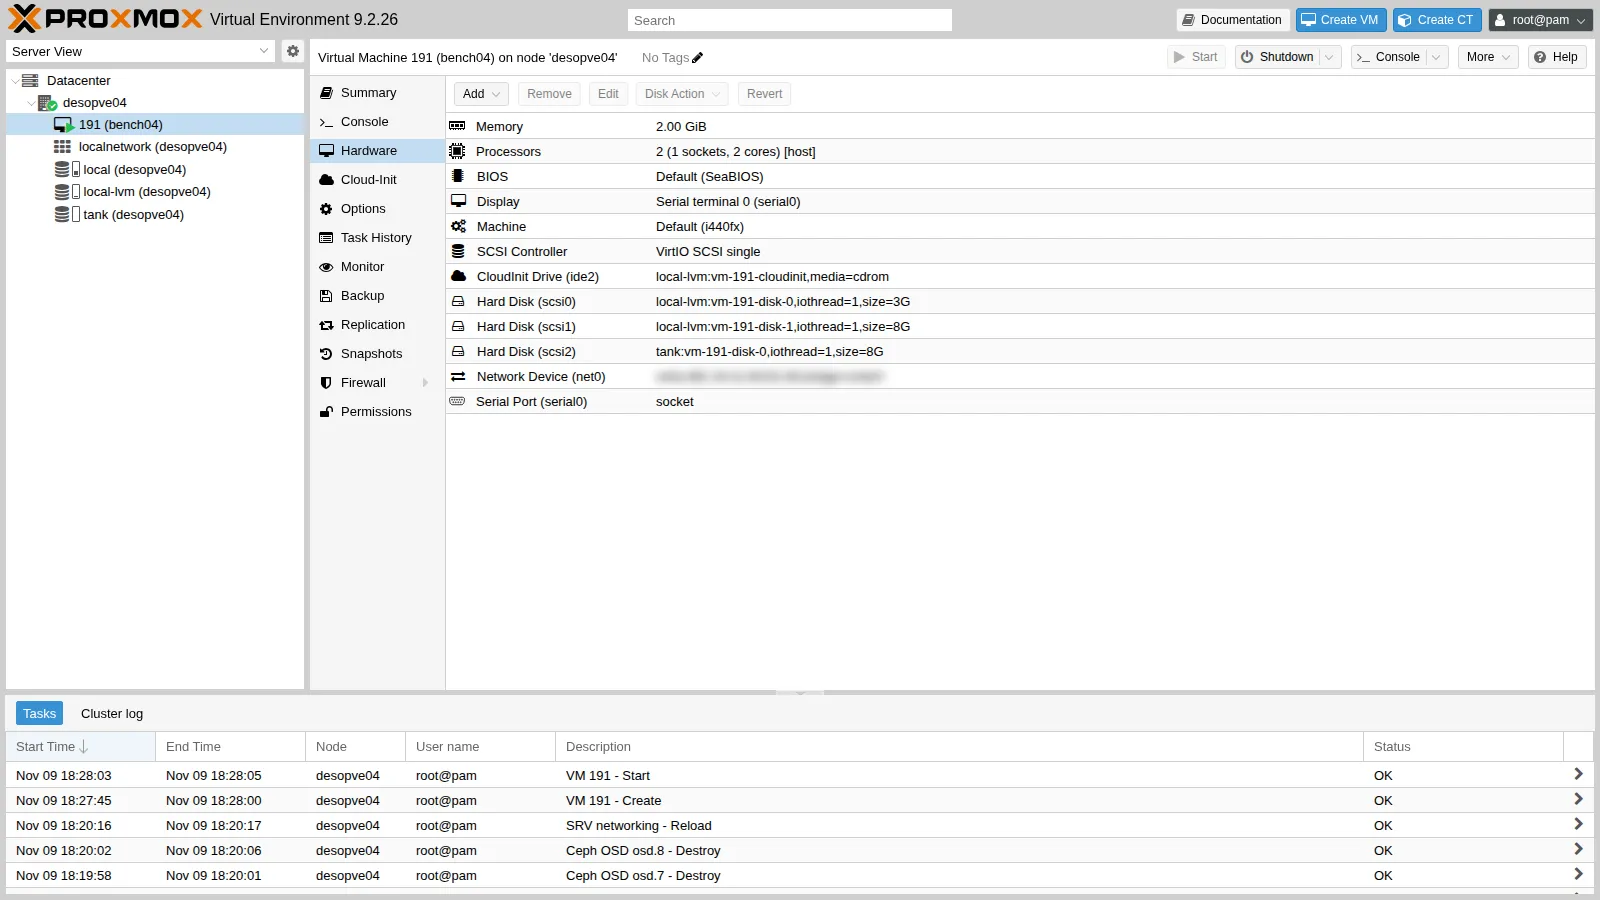
The SMB storage (
nas-smb) is not part of the comparison: Proxmox can use it for VM disks, but in lab 14 we configured it only for ISOs and backups, which is the recommended use. -
Log in to the VMs with the key created in step 1 (
bench04the same way, fromdesopve04to.191):root@desopve01 Install fio. The cloud image uses the Debian repositories over HTTPS, so the proxy must be declared for
httpsas well:labuser@bench01 printf 'Acquire::http::Proxy "http://proxy.proxmox.community:3128";\nAcquire::https::Proxy "http://proxy.proxmox.community:3128";\n' | sudo tee /etc/apt/apt.conf.d/80proxysudo apt-get update && sudo apt-get install -y fiofio --versionOutput fio-3.39labuser@bench01 ls -l /dev/disk/by-id/ | grep drive-scsi | awk '{print $9, $11}'Output scsi-0QEMU_QEMU_HARDDISK_drive-scsi0 ../../sdb...scsi-0QEMU_QEMU_HARDDISK_drive-scsi1 ../../sdascsi-0QEMU_QEMU_HARDDISK_drive-scsi2 ../../sdcscsi-0QEMU_QEMU_HARDDISK_drive-scsi3 ../../sddscsi-0QEMU_QEMU_HARDDISK_drive-scsi4 ../../sdeThe
sdXnames do not follow the order of the disks: herescsi1issdaand the system disk issdb. To avoid writing to the wrong disk, the script uses the stabledrive-scsiNnames in/dev/disk/by-id.
2. The test script
Section titled “2. The test script”The script is published in files/19/bench.sh. Create it in both VMs, for example by pasting it with a here document, and make it executable:
cat > ~/bench.sh <<'FINE'(paste the contents of bench.sh here)FINEchmod +x ~/bench.shIts contents:
#!/bin/bash# bench.sh label:scsiN ... : same fio jobs on every disk, 2 runs, JSON results in ~/resset -umkdir -p ~/resfor pair in "$@"; do lab=${pair%%:*}; dev=/dev/disk/by-id/scsi-0QEMU_QEMU_HARDDISK_drive-${pair##*:} # preconditioning: write the whole test area, so that reads never hit unallocated blocks sudo fio --name=fill --filename=$dev --rw=write --bs=1M --size=2G --direct=1 --ioengine=libaio --iodepth=16 --output-format=json --output=$HOME/res/$lab-fill.json >/dev/null for run in 1 2; do for job in "rr4k randread 4k 32" "rw4k randwrite 4k 32" "rw4kqd1 randwrite 4k 1" "sr1m read 1M 16" "sw1m write 1M 16"; do set -- $job sudo fio --name=$1 --filename=$dev --rw=$2 --bs=$3 --iodepth=$4 --size=2G --direct=1 --ioengine=libaio \ --time_based --runtime=20 --ramp_time=3 --output-format=json --output=$HOME/res/$lab-$1-$run.json >/dev/null done done echo "$(date +%T) $lab finito"donetouch ~/res/DONEStart it in the background on bench01 and, only when it has finished, on bench04:
nohup ./bench.sh local-zfs:scsi1 nas-nfs:scsi2 nas-lvm:scsi3 rbd-vm:scsi4 > bench.log 2>&1 &cat bench.log17:36:30 local-zfs finito17:41:39 nas-nfs finito17:46:13 nas-lvm finito17:51:30 rbd-vm finitonohup ./bench.sh local-lvm:scsi1 tank:scsi2 > bench.log 2>&1 &Then one last job for each disk, with an fsync after every write:
sudo fio --name=sync --filename=/dev/disk/by-id/scsi-0QEMU_QEMU_HARDDISK_drive-scsi1 \ --rw=randwrite --bs=4k --iodepth=1 --fsync=1 --size=2G --direct=1 --ioengine=libaio \ --time_based --runtime=15 --ramp_time=2 --output-format=jsonThe fio JSON files hold everything: IOPS, bandwidth, mean latencies and percentiles. The files/19/riassunto.py script builds the table for the plain workload: it reads jobs[0].read and jobs[0].write from each file and computes the average and the spread of the two runs. For latency it uses clat_ns.mean, the mean completion latency:
python3 riassunto.py ~/resFor the fsync table, read jobs[0].write.iops, jobs[0].write.lat_ns.mean (total latency) and jobs[0].sync.lat_ns.mean (fsync latency) in the JSON of the last job. The 99th percentile of the QD1 write without fsync is in jobs[0].write.clat_ns.percentile of the rw4kqd1 files: unless told otherwise, fio computes percentiles on the completion latency.
Verification and tests: the results
Section titled “Verification and tests: the results”The test has succeeded when:
- every storage has the JSON files of all the jobs, for both runs, and
~/res/DONEexists; riassunto.pyprints a table with no empty cells;- you can explain, or at least check, the spread between the two runs.
The absolute values depend on the infrastructure. The ones below are the results of the run described in Test environment and versions.
Plain workload (no fsync)
Section titled “Plain workload (no fsync)”| Storage | 4k random read QD32 (IOPS) | 4k random write QD32 (IOPS) | 4k write QD1, mean completion latency (clat, ms) | 1M sequential read (MB/s) | 1M sequential write (MB/s) |
|---|---|---|---|---|---|
local-zfs (ZFS mirror, local) |
44,289 (±3%) | 2,336 (±50%) | 0.21 (±6%) | 3,289 (±0%) | 42 (±19%) |
local-lvm (LVM-thin, local) |
29,414 (±2%) | 9,347 (±20%) | 1.70 (±4%) | 291 (±3%) | 540 (±9%) |
tank (ZFS RAIDZ1, local) |
27,866 (±3%) | 3,398 (±15%) | 0.79 (±30%) | 1,036 (±3%) | 44 (±35%) |
nas-nfs (NFS 4.2) |
25,069 (±9%) | 181 (±6%) | 4.47 (±3%) | 1,208 (±1%) | 21 (±23%) |
nas-lvm (iSCSI + LVM, multipath) |
20,424 (±5%) | 4,182 (±15%) | 0.74 (±17%) | 1,082 (±2%) | 15 (±36%) |
rbd-vm (Ceph, 3-way replication) |
10,357 (±17%) | 306 (±11%) | 8.31 (±25%) | 983 (±1%) | 20 (±27%) |
Writes with fsync (fsync after every write, QD1)
Section titled “Writes with fsync (fsync after every write, QD1)”| Storage | IOPS | Mean total write latency (lat, ms) | Mean fsync latency (ms) | QD1 write without fsync: 99th percentile completion latency (clat, ms) |
|---|---|---|---|---|
local-zfs |
288 | 0.52 | 3.39 | 1.06 |
local-lvm |
534 | 1.46 | 1.80 | 3.95 |
tank |
145 | 0.48 | 6.79 | 3.06 |
nas-nfs |
194 | 4.82 | 4.63 | 55.31 |
nas-lvm |
138 | 0.83 | 7.12 | 2.54 |
rbd-vm |
26 | 38.21 | 38.53 | 42.21 |
Reading the results
Section titled “Reading the results”Each point separates what the test measured from how we interpret it, and names the check that would confirm the interpretation.
- Sequential reads.
- Measured:
local-zfsreads sequentially at 3,289 MB/s,tankat 1,036 MB/s andlocal-lvmat 291 MB/s. - Interpretation: the
local-zfsfigure is consistent with a large contribution from the cache, since the preconditioning had just written the test area. This measurement, however, does not separate the effect of the ARC from the rest of the I/O path. The same applies totank, which has a smaller ARC (2 GiB). The 291 MB/s oflocal-lvmlikewise describe the configuration under test: attributing them to the disk alone needs an additional check. The reads fromnas-nfs(1,208 MB/s) andnas-lvm(1,082 MB/s) may partly come from the cache of the NAS, which also runs ZFS, but this test does not show it. - How to check:
- during the test, watch the ARC statistics on the node (and on the NAS) with
arcstat 1: a hit rate close to 100% means reads are served from RAM; - repeat the reads on a test area larger than the RAM available to the ARC, or with
primarycache=metadatatemporarily set on the test zvol; - for
local-lvm, benchmark the physical disk directly from the node with fio in read-only mode (--readonly --direct=1); comparing it with the VM result shows how much the rest of the path costs.
- during the test, watch the ARC statistics on the node (and on the NAS) with
- Measured:
- Ceph and the single operation.
- Measured: QD1 writes on
rbd-vmhave a mean completion latency of 8.31 ms (±25%), against 0.21-1.70 ms on the local storages. With anfsyncafter every write the rate drops to 26 IOPS, at 38.53 ms perfsync. - Interpretation: this is consistent with how Ceph acknowledges a write: the primary OSD forwards it to the other two replicas and replies only after they confirm, so every operation crosses the network several times. The test does not, however, separate the network’s share from that of the OSD disks, nor from the access path, which differs too: QEMU reaches
rbd-vmthrough librbd, while the other disks are files or block devices on the node. - How to check: during the test,
ceph osd perfshows the commit latency of each OSD;rados bench -p rbd-vm 30 write -b 4096 -t 1measures single-queue 4k writes without the VM in the way; apingbetween nodes on the Ceph VLAN gives the latency of the network alone. With deeper queues and more clients, Ceph spreads the work across many OSDs, which is why it should also be measured in parallel (see below).
- Measured: QD1 writes on
- NFS and iSCSI on the same NAS.
- Measured: QD32 random writes reach 181 IOPS on
nas-nfsand 4,182 onnas-lvm. With anfsyncafter every write the two get close: 194 and 138 IOPS. - Interpretation: the gap is consistent with how the two protocols acknowledge writes. The NFS server would acknowledge the client’s
O_DIRECTwrites only once they are on stable storage, whereas over iSCSI the NAS can acknowledge from RAM and write later, unless the client asks for a flush. The values converging withfsyncpoints the same way, but this test does not prove it. The two disks also differ in theiraiomode,io_uringonnas-nfsandnativeonnas-lvm(see Test environment and versions), and the test does not separate that effect from the protocol’s. - How to check: on the NAS,
zfs get sync dati/nfs dati/iscsi/pveshows how ZFS handles synchronous writes on the two volumes; on the node,nfsstat -mshows the effective NFS mount options. If the interpretation is right, repeating the test withsync=alwayson the iSCSI zvol should bringnas-lvmclose to NFS. Settingaio=nativeon thenas-nfsdisk as well removes the difference inaiomode from the comparison.
- Measured: QD32 random writes reach 181 IOPS on
- Variability.
- Measured: QD32 random writes and sequential writes vary by up to ±50% between the two runs (
local-zfs), and by ±35-36% ontankandnas-lvm. - Interpretation: there is more than one possible cause: activity elsewhere in the lab (Ceph, the NAS, the shared network), and the periodic flushes with which ZFS commits data to disk every few seconds, which land differently in two 20-second windows. The test cannot tell them apart.
- How to check: more and longer runs, with the rest of the lab idle, while recording disk activity on the node with
iostat -x 1orzpool iostat 1.
- Measured: QD32 random writes and sequential writes vary by up to ±50% between the two runs (
- Sequential writes on
local-lvm.- Measured:
local-lvmwrites sequentially at 540 MB/s and reads at 291 MB/s. Withfsyncit completes 534 writes per second, at 1.80 ms perfsync. - Interpretation: writes faster than reads, and flushes acknowledged in under 2 ms, suggest a write cache below LVM, in the controller or in the disk. The test does not tell which layer provides it, nor whether it is protected against power loss.
- How to check: the write-cache state of the disk (
hdparm -Worsdparm --get=WCE) and of the controller, and a longer sequential write that exceeds the cache size.
- Measured:
In short: the ratios between the storages hold for this infrastructure. With different hardware, networks and versions they change, sometimes a lot. The method, on the other hand, carries over as it is.
What to measure in production
Section titled “What to measure in production”- A preconditioned test area larger than the RAM of the nodes (and of the NAS), so that caches do not distort the reads.
- More runs, longer ones (at least 60 seconds), at different times of day. Report the median and percentiles (p99), not only the mean, and always state which latency you report (clat or lat).
- Both the plain workload and the one with
fsync: a database lives onfsync. - For Ceph: several VMs or several parallel jobs (
--numjobs), because Ceph spreads the load across many OSDs.rados benchandrbd benchmeasure the cluster without a VM in between. - Write everything down, as in Test environment and versions: versions, disk options (
cache,iothread,discard, and theaiomode actually in use, read withqm showcmd, since its default depends on the storage), block size and queue depth, size of the test area, date.
Cleanup
Section titled “Cleanup”Destroy the test VMs along with their disks and delete the test SSH key:
qm stop 190 && qm destroy 190 --purge && rm -f /root/bench /root/bench.pubqm stop 191 && qm destroy 191 --purge && rm -f /root/bench /root/bench.pubFinal lab state
Section titled “Final lab state”- The state of the cluster, of Ceph and of
desopve04is the one left by Lab 18: no test VMs, and the storages as empty as before. - The
debian-13-genericcloud-amd64.qcow2image stays in thelocalstorage (content import) ofdesopve01anddesopve04: it will be used for the templates in lab 40.
What you learned
Section titled “What you learned”- Telling whether a benchmark measures the workload you care about. Before trusting a number you check five things: whether reads can come from a cache (a freshly written area, smaller than RAM, with the ARC active); whether fio uses
--direct=1; how large the test area is compared with the RAM of the nodes and of the NAS; how long each test runs; how many runs you have and how far apart they are. - Picking the metric that answers the question. IOPS at deep queues describe the parallel load of many VMs. QD1 latency describes an application that waits for every write, and you should say which latency you mean (clat or lat). Bandwidth matters for backups and copies.
- Deciding when you need the
fsynctest. If the real workload callsfsync(databases, logs), a result withoutfsyncdoes not represent it. - Keeping measurements and explanations apart. Next to every interpretation you can name the check that would confirm it:
arcstat,ceph osd perf,rados bench, a test on the node’s own disk. - Using a comparison for what it is. A storage comparison holds for the infrastructure it was run on: before a production decision, repeat the same method on the production hardware.
References
Section titled “References”- fio – documentation
- fio – interpreting the output: slat, clat and lat
- Proxmox VE – Virtual disk options (cache, iothread, aio)
- Proxmox VE – qemu-server source,
Drive.pm: the defaultaiomode for each storage type (storage_allows_io_uring_default,aio_cmdline_option) - Proxmox VE – Cloud-init support
- Proxmox VE –
qmand importing disk images (import-from) - OpenZFS – the
primarycacheproperty - Ceph –
rados bench(theradosman page) - Proxmox – Proxmox VE Ceph Benchmark 2023/12
- Ceph – Hardware recommendations