

Lab 34 – Network performance and troubleshooting
Dependencies
Section titled “Dependencies”- Previous labs:
- Lab 20 and Lab 21: VLAN-aware
vmbr1onbond0, CTs 121 and 122 in VLAN 10; - Lab 22: dedicated networks and the lab MTU;
- Lab 29: CTs 291 and 292 on the VXLAN VNet
vnvx1(MTU 1450); - Lab 32 and Lab 33: firewall of CT 101 and the test script
fwtest.ps1on the DC; - Lab 26:
router01, gateway 10.10.10.1 of the CTs in VLAN 10; - Lab 05: the DC’s SSH key, authorized on the nodes and copied into the test VMs;
- Lab 24 and Lab 25: CT 404 on
desopve04.
- Lab 20 and Lab 21: VLAN-aware
- Resources: the cloud image
debian-13-genericcloud-amd64.qcow2inlocal:importondesopve01, downloaded in Lab 19. It is used to create two test VMs with cloud-init, covered in depth in Lab 40. - Credentials:
root/<lab-password>→ Appendix B.
Objectives
Section titled “Objectives”- A before-and-after measurement of the effect of multiqueue between two VMs, with one stream and with four, from which to decide whether to enable it.
- The bandwidth limit
rateof a network device checked in both directions, with the mechanism that enforces it (tc) read on the node. - The active offloads and the MTU of a path read with
ethtoolandping -M do, knowing what each test shows and what it does not. - A toolkit of commands for diagnosing the network of a Proxmox VE node, tried out on the lab.
- Six typical failures reproduced and fixed following the pattern symptom → check → cause → fix, each with proof that the fix worked.
How it works
Section titled “How it works”Where a packet goes
Section titled “Where a packet goes”Before hunting for a failure, it helps to have the path in mind. For a VM or a CT on vmbr1:
guest eth0 ──► tap<vmid>i0 (VM) / veth<vmid>i0 (CT) ──► vmbr1 (VLAN-aware) ──► bond0 ──► nic3/nic4 ──► network │ │ guest firewall VLAN and MAC table (nftables: bridge table) (bridge vlan / bridge fdb)Each arrow is a point where you can look with tcpdump, and each object has its own command to read its state.
Multiqueue
Section titled “Multiqueue”By default, a VirtIO network device has one transmit queue and one receive queue, served by a single vhost thread on the host and by a single CPU in the guest. With queues=N the device exposes N of them, and the traffic of multiple connections is spread across multiple CPUs, both in the guest and on the host. It helps when a single queue is the bottleneck and there are idle CPUs; it does not multiply the bandwidth of a single connection. The Proxmox VE documentation recommends as many queues as the guest has vCPUs. It also warns that more queues increase the CPU load on host and guest as traffic grows, and suggests the option only for VMs that handle many incoming connections, such as routers, reverse proxies or busy web servers.
Bandwidth limit
Section titled “Bandwidth limit”rate= on the network device is given in MB/s, and Proxmox VE multiplies it by 1024 × 1024: rate=10 means 10 MiB/s, or 83.9 Mbit/s. It is enforced with Linux traffic control on the host’s tap interface, in two different ways:
- towards the guest: with an
htbqueue, which delays packets (shaping); - from the guest: with a
policeaction on ingress, which drops whatever exceeds the limit (policing).
For TCP the difference is noticeable, as the measurements will show.
Test environment and versions
Section titled “Test environment and versions”The measurements in steps 2-4 come from a run carried out in November 2026 with the configuration described below. With other versions, options or hardware, the same commands give different numbers.
| Component | Configuration used |
|---|---|
| Proxmox VE | 9.2.26, kernel 7.0.14-28-pve (Lab 04); QEMU 11.1.3 (Lab 35) |
| Node | desopve01, 4 cores and 32 GB of RAM (Lab 01), running the guests and services left by the previous labs: for example CT 121, the VM router01 (step 5) and the Ceph OSDs (Lab 17) |
| Test VMs | two Debian 13 VMs from the cloud image, 4 vCPUs of type host and 2 GiB of RAM each, VirtIO network device on vmbr0, both on desopve01: 8 vCPUs on 4 cores |
| Tool | iperf3 3.18 in the guests, TCP with default options, 8-second runs; the values are those of the receiver line, that is the data that reached the receiver (with -P 4, the SUM line aggregates the four streams) |
| Network | MTU 1500 (Lab 21); traffic between the two VMs stays inside the node and never crosses a physical NIC or a switch |
What the test measures, and what it does not. The multiqueue and bandwidth-limit tests measure TCP traffic between two VMs on the same node: the CPUs of the node and of the guests, the virtio/vhost path and the bridge. They say nothing about traffic that crosses the physical network, and they do not measure CPU usage during the runs. Each case has two 8-second rounds (multiqueue) or a single run (bandwidth limit): enough for an order of magnitude and the direction of an effect, not a statistic.
Procedure
Section titled “Procedure”1. The test VMs
Section titled “1. The test VMs”Two identical Debian 13 VMs on the same node (desopve01), on the management network, created from the cloud image with the user labuser and the SSH keys authorized on the node, including the DC’s key (Lab 05):
for id in 341 342; do ip=172.27.199.$((id-200)) qm create $id --name perf-$id --memory 2048 --cores 4 --cpu host \ --net0 virtio,bridge=vmbr0 --scsihw virtio-scsi-single \ --scsi0 local-zfs:0,import-from=local:import/debian-13-genericcloud-amd64.qcow2 \ --ide2 local-zfs:cloudinit --boot order=scsi0 \ --ipconfig0 ip=$ip/24,gw=172.27.199.1 --nameserver 172.27.199.20 \ --ciuser labuser --sshkeys /root/.ssh/authorized_keys --serial0 socket --vga serial0 qm start $iddoneThe two VMs temporarily take the addresses .141 and .142 and are deleted at the end of the lab. If you have already done Lab 41, where .141 and .142 belong to CTs 141 and 142, pick two free addresses (for example .181 and .182) by changing $((id-200)).
From the DC, log in to each VM with ssh [email protected] (and .142) and install iperf3 through the lab proxy:
echo 'Acquire::http::Proxy "http://proxy.proxmox.community:3128";' | sudo tee /etc/apt/apt.conf.d/90proxysudo apt-get update && sudo apt-get install -y iperf3echo "$(hostname): $(iperf3 --version | head -1); code: $(ls /sys/class/net/eth0/queues | tr '\n' ' ')"perf-341: iperf 3.18 (cJSON 1.7.15); code: rx-0 tx-0perf-342: iperf 3.18 (cJSON 1.7.15); code: rx-0 tx-0rx-0 tx-0: a single queue per direction.
2. Multiqueue: before and after
Section titled “2. Multiqueue: before and after”iperf3 server on 342, client on 341. Two rounds, 8 seconds each, with 1 and with 4 parallel streams:
# on 342iperf3 -s -D# on 341for giro in 1 2; do echo "== 1 flusso"; iperf3 -c 172.27.199.142 -t 8 | grep receiver echo "== 4 flussi"; iperf3 -c 172.27.199.142 -t 8 -P 4 | grep "SUM.*receiver"doneOne queue (default):
== 1 flusso[ 5] 0.00-8.00 sec 10.5 GBytes 11.3 Gbits/sec receiver== 4 flussi[SUM] 0.00-8.01 sec 11.0 GBytes 11.8 Gbits/sec receiver== 1 flusso[ 5] 0.00-8.00 sec 11.4 GBytes 12.3 Gbits/sec receiver== 4 flussi[SUM] 0.00-8.02 sec 11.8 GBytes 12.7 Gbits/sec receiverEnable 4 queues on both: Hardware → Network Device → Advanced → Multiqueue: 4, then reboot the VMs. From the command line you must repeat the MAC address of the device (read it with qm config <id> | grep net0), otherwise Proxmox VE generates a new one:
for id in 341 342; do qm set $id --net0 virtio=<VM-MAC>,bridge=vmbr0,queues=4 qm reboot $iddoneThe guest now has 4 queues per direction:
ls /sys/class/net/eth0/queues | tr '\n' ' '; echoethtool -l eth0 | grep -E "parameters|maximums|hardware|Combined"rx-0 rx-1 rx-2 rx-3 tx-0 tx-1 tx-2 tx-3Channel parameters for eth0:Pre-set maximums:Combined: 4Current hardware settings:Combined: 4Four queues:
== 1 flusso[ 5] 0.00-8.01 sec 11.4 GBytes 12.2 Gbits/sec receiver== 4 flussi[SUM] 0.00-8.02 sec 9.11 GBytes 9.76 Gbits/sec receiver== 1 flusso[ 5] 0.00-8.00 sec 12.1 GBytes 13.0 Gbits/sec receiver== 4 flussi[SUM] 0.00-8.02 sec 9.04 GBytes 9.68 Gbits/sec receiveriperf3 receiver line, two rounds |
1 stream | 4 streams (aggregate SUM) |
|---|---|---|
| 1 queue | 11.3-12.3 Gbit/s | 11.8-12.7 Gbit/s |
| 4 queues | 12.2-13.0 Gbit/s | 9.7-9.8 Gbit/s |
- Measured: with four streams, the aggregate drops from 11.8-12.7 Gbit/s with one queue to 9.7-9.8 Gbit/s with four, about 20% less, in both rounds. With one stream it goes from 11.3-12.3 to 12.2-13.0 Gbit/s: the ranges overlap, so no difference is established.
- Interpretation: the drop with four streams is consistent with CPU contention. The two VMs have 8 vCPUs between them on a 4-core node, and with four queues per device more
vhostthreads are at work too; the Proxmox VE documentation warns precisely that more queues increase the CPU load. The test did not measure CPU usage, though, so it does not prove it. - How to check: during the run,
top -H(orpidstat -t 1, from thesysstatpackage) on the node shows how much CPU thevhost-<pid>threads and the vCPU threads use, andmpstat -P ALL 1shows whether the four cores are saturated. Repeating the test with the two VMs on different nodes, or with fewer vCPUs, tells you whether the drop comes from contention.
In this lab, then, multiqueue should stay off. It can pay off when:
- the VM has many concurrent connections (web servers, proxies, virtual routers);
- the host has idle cores;
- a single queue is the measured limit.
Always verify it with a before-and-after test, as done here.
3. Bandwidth limit
Section titled “3. Bandwidth limit”On VM 342, set a limit of 10 MB/s (rate=10), keeping the 4 queues.
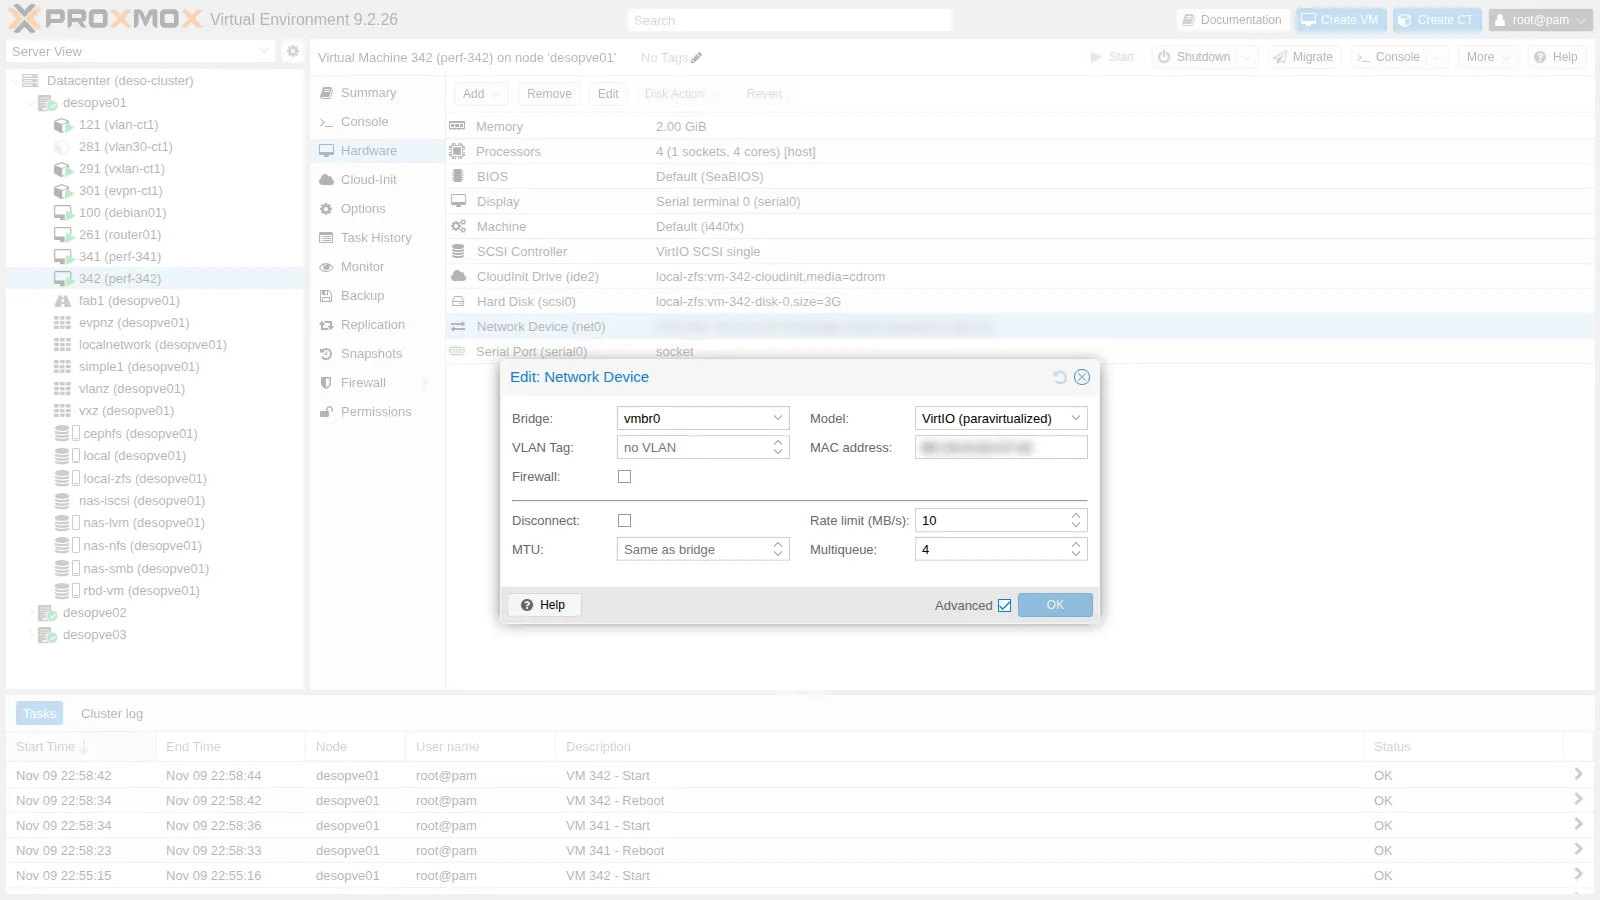 On the node, the limit becomes:
tc -s qdisc show dev tap342i0tc filter show dev tap342i0 parent ffff: | grep policeqdisc htb 1: root refcnt 257 r2q 10 default 0x1 direct_packets_stat 1 direct_qlen 1000 Sent 13626 bytes 9 pkt (dropped 0, overlimits 0 requeues 0) backlog 0b 0p requeues 0qdisc ingress ffff: parent ffff:fff1 ---------------- Sent 0 bytes 0 pkt (dropped 0, overlimits 0 requeues 0) backlog 0b 0p requeues 0 police 0x1 rate 83886Kbit burst 1Mb mtu 64Kb action drop overhead 0bThe police line shows rate 83886Kbit, that is 10 × 1024 × 1024 bytes per second = 83.9 Mbit/s, with a 1 MiB burst (burst 1Mb): the value set in MB/s is applied in MiB/s.
The measurements in both directions, one TCP stream at a time:
== verso la VM 342 (ingresso della VM limitata)[ 5] 0.00-8.00 sec 79.9 MBytes 83.7 Mbits/sec 4 sender[ 5] 0.00-8.16 sec 77.8 MBytes 80.0 Mbits/sec receiver== dalla VM 342 (uscita della VM limitata, -R)[ 5] 0.00-8.00 sec 48.6 MBytes 51.0 Mbits/sec 4639 sender[ 5] 0.00-8.00 sec 47.8 MBytes 50.1 Mbits/sec receiver- Towards the VM.
- Measured: 80.0 Mbit/s on the
receiverline, with 4 retransmissions. - Interpretation: that is 95% of the 83.9 Mbit/s limit. iperf3 counts only application data, while the limit counts whole packets; with 1500-byte frames the headers account for about 4-5%, so the result is consistent with a limit enforced almost exactly. The handful of retransmissions fits the
htbqueue, which delays packets instead of dropping them, and TCP adapting to it. - How to check: after the run,
tc -s class show dev tap342i0shows the bytes that went through thehtbclass, headers included, to compare with the 77.8 MBytes (MiB) iperf3 reports as received.
- Measured: 80.0 Mbit/s on the
- From the VM.
- Measured: 50.1 Mbit/s on the
receiverline, with 4639 retransmissions. - Interpretation: that is 60% of the limit. It is consistent with the
policeaction, which drops packets beyond the limit: TCP reads the losses as congestion and slows down more than it needs to. - How to check: after the run,
tc -s filter show dev tap342i0 parent ffff:shows thepolicecounters, to compare with the retransmissions.
- Measured: 50.1 Mbit/s on the
In this configuration, with a single TCP stream between two VMs on the same node, the limit was accurate for traffic towards the guest, while outbound traffic achieved 60% of the configured value. With several streams, with UDP or with a different congestion control algorithm the ratio may change, so measure it with your real traffic.
4. Offloads and path MTU
Section titled “4. Offloads and path MTU”Offloads move work away from the CPU to the NIC or the kernel: checksum calculation, segmentation of large packets (TSO/GSO), receive aggregation (GRO). On a physical port of the node and on the tap interface of a VM:
for i in nic0 tap341i0; do echo "-- $i" ethtool -k $i | grep -E "^(rx-checksumming|tx-checksumming|tcp-segmentation-offload|generic-segmentation-offload|generic-receive-offload):"done-- nic0rx-checksumming: ontx-checksumming: ontcp-segmentation-offload: ongeneric-segmentation-offload: ongeneric-receive-offload: on-- tap341i0rx-checksumming: off [fixed]tx-checksumming: ontcp-segmentation-offload: ongeneric-segmentation-offload: ongeneric-receive-offload: onTwo VMs on the same node exchange traffic without going through a physical NIC, so the speed of the node’s ports (10 GbE, Lab 01) is no limit for the tests in steps 2 and 3. With TSO, GSO and GRO active, the kernel can move chunks of up to 64 KB instead of 1500-byte frames. That is consistent with the 9.7-13.0 Gbit/s measured, but the test did not measure how much the offloads contribute: to find out, repeat iperf3 after turning TSO and GSO off in the guest (ethtool -K eth0 tso off gso off, for the test only). Offloads are also why a tcpdump on the tap interface shows packets larger than the MTU; turning them off is a diagnostic step.
The MTU of a path is measured with packets of increasing size and the Don’t Fragment bit set (-M do). 1472 bytes of data plus 28 bytes of ICMP and IP headers make 1500. From VM 341:
ping -M do -s 1472 -c1 172.27.199.22 | grep transmittedping -M do -s 1473 -c1 172.27.199.221 packets transmitted, 1 received, 0% packet loss, time 0msPING 172.27.199.22 (172.27.199.22) 1473(1501) bytes of data.ping: sendmsg: Message too longThe 1472-byte probe gets through, so the path from VM 341 to desopve02 (172.27.199.22), across the physical network, carries 1500-byte packets. The 1473-byte probe is refused by the guest itself (sendmsg: Message too long) before it leaves, because it exceeds the MTU of its own interface: it shows the VM’s MTU, not the limit of the switches. That limit is measured in Lab 21: the path between the nodes carries packets of up to 8938 bytes (8910 of ICMP data), while 9000-byte jumbo frames do not get through. The management network therefore runs at MTU 1500 because that is the MTU configured on the interfaces.
5. The troubleshooting toolkit
Section titled “5. The troubleshooting toolkit”| Question | Command |
|---|---|
| Which VLAN is a guest’s port in? | bridge vlan show dev veth121i0 |
| Where did the bridge learn a MAC address? | bridge fdb show br vmbr1 |
| Is the bond healthy, and which link is it using? | cat /proc/net/bonding/bond0 |
| What type of interface is it, and with which parameters? | ip -d link show <if> |
| Is the traffic arriving? With which tag? | tcpdump -eni <if> <filter> |
| Is the firewall on? With which rules? | pve-firewall status, nft list ruleset |
| What happened to a connection? | conntrack -L, conntrack -S, conntrack -C |
| Are the dynamic routing protocols up? | vtysh -c "show bgp summary" |
| Which sockets are open? | ss -tulpn |
Real examples, on desopve01:
== bridge vlan show dev veth121i0port vlan-idveth121i0 10 PVID Egress Untagged== bridge fdb show br vmbr1 | grep " vlan 10 " | grep -v permanentbc:24:11:10:9a:74 dev bond0 vlan 10 master vmbr1bc:24:11:af:bc:fc dev veth121i0 vlan 10 master vmbr1bc:24:11:23:9b:72 dev tap261i1 vlan 10 master vmbr1== bond0Bonding Mode: fault-tolerance (active-backup)Currently Active Slave: nic3MII Status: upSlave Interface: nic3MII Status: upSlave Interface: nic4== conntrack467bridge vlan: the port of CT 121 hasPVID10 andEgress Untagged. The bridge adds and removes tag 10, and the guest sees untagged traffic.bridge fdb: in VLAN 10 the bridge knows three MAC addresses. Two are on local ports: CT 121 (veth121i0) and the second network device ofrouter01(tap261i1). The third,bc:24:11:10:9a:74, is CT 122, which runs on another node and was learned through thebond0trunk. Thepermanententries, excluded by the filter, are the addresses of the bridge itself.
6. Six failures reproduced and fixed
Section titled “6. Six failures reproduced and fixed”Run each command on the node that hosts the guest: CTs 101 and 122 are on desopve02, CTs 121 and 291 on desopve01, CT 404 on desopve04.
Failure 1 – Wrong VLAN
Section titled “Failure 1 – Wrong VLAN”Triggered: CT 122 is moved by mistake from tag 10 to tag 11.
pct set 122 --net0 name=eth0,bridge=vmbr1,gw=10.10.10.1,hwaddr=BC:24:11:10:9A:74,ip=10.10.10.122/24,tag=11Symptom: CT 121, in the same subnet, can no longer reach CT 122.
2 packets transmitted, 0 received, 100% packet loss, time 1010msCheck: on the node of CT 122, the port and the traffic arriving from the trunk.
port vlan-idveth122i0 11 PVID Egress Untagged... ethertype 802.1Q (0x8100), length 64: vlan 10, p 0, ethertype ARP (0x0806), Request who-has 10.10.10.122 tell ...... ethertype 802.1Q (0x8100), length 64: vlan 10, p 0, ethertype ARP (0x0806), Request who-has 10.10.10.122 tell ...Cause: the ARP requests arrive on bond0 with tag 10, but the CT’s port is in VLAN 11: the bridge does not deliver them to it.
Fix: tag=10 again:
pct set 122 --net0 name=eth0,bridge=vmbr1,gw=10.10.10.1,hwaddr=BC:24:11:10:9A:74,ip=10.10.10.122/24,tag=10,type=vethveth122i0 10 PVID Egress Untagged2 packets transmitted, 2 received, 0% packet loss, time 1001msFailure 2 – Wrong MTU on a VXLAN VNet
Section titled “Failure 2 – Wrong MTU on a VXLAN VNet”The VNet vnvx1 has an MTU of 1450: 50 bytes go to the VXLAN encapsulation. In CT 291, with the correct MTU, a larger packet is rejected right away by the guest’s own network stack, which knows it cannot send it:
mtu 14501 packets transmitted, 1 received, 0% packet loss, time 0msPING 10.62.62.12 (10.62.62.12) 1423(1451) bytes of data.ping: sendmsg: Message too longTriggered: in the CT, the interface MTU is raised to 1500.
pct exec 291 -- ip link set eth0 mtu 1500Symptom: small packets get through, full-size ones do not. The guest tries to send them, but its interface is larger than the link towards the host, which has 1450:
ping: sendmsg: No buffer space availableping: sendmsg: No buffer space available2 packets transmitted, 0 received, 100% packet loss, time 4021ms2 packets transmitted, 2 received, 0% packet loss, time 1001msThe first test uses 1472-byte packets, the second 1422-byte packets.
Check: ip link show eth0 in the guest and ping -M do with increasing sizes, until you find the limit.
Cause: the guest’s MTU is larger than the VNet’s. With real traffic, the typical symptom is “SSH logs in but hangs as soon as there is a lot of output”, or “small pages load, downloads do not”.
Fix: MTU 1450 (as in Lab 29, also in the CT’s network file, so that it persists after a reboot).
1 packets transmitted, 1 received, 0% packet loss, time 0msFailure 3 – A firewall rule that blocks
Section titled “Failure 3 – A firewall rule that blocks”Triggered: a wrong rule is added at the top of the rules of CT 101.
pvesh create /nodes/desopve02/lxc/101/firewall/rules --type in --action DROP \ --macro HTTP --source dc/dc01 --enable 1 --comment "regola di prova errata"Symptom: from the DC, the web server of CT 101 no longer responds, while SSH and ping still work.
DC 172.27.199.20 (admin) HTTP BLOCCATO SSH ok ping okCheck: the firewall log shows nothing. The rule has no log, and the guest log (log_level_in) records only what reaches the policy. You have to look at the rules:
Status: enabled/running (pending changes)0table bridge proxmox-firewall-guests { chain guest-101-in { jump pre-vm-in oifname "veth101i0" arp daddr ip != @v4-guest-101/ipfilter-net0 drop jump allow-dhcp-in jump allow-ndp-in ct mark set 0x00000065 tcp dport 80 ip saddr 172.27.199.20 drop[RULES]
IN HTTP(DROP) -source dc/dc01 # regola di prova errataOUT REJECT -dest dc/dc01 -p tcp -dport 445 -log info # Nessuna connessione SMB verso il DCGROUP web-serverGROUP accesso-adminCause: the DROP rule is at position 0 and wins over the web-server group, which comes after it.
Fix: delete the rule at position 0 with pvesh delete /nodes/desopve02/lxc/101/firewall/rules/0. After the firewall update cycle, from the DC with .\fwtest.ps1:
DC 172.27.199.20 (admin) HTTP ok SSH ok ping okFailure 4 – Missing gateway
Section titled “Failure 4 – Missing gateway”Triggered: CT 122 loses its gateway (gw= removed from net0).
Symptom: the local subnet works, everything else does not, and with an immediate error instead of a timeout:
1 packets transmitted, 1 received, 0% packet loss, time 0msping: connect: Network is unreachableThe first line is the ping to 10.10.10.121, the second the one to 172.27.199.20.
Check: ip route in the guest.
10.10.10.0/24 dev eth0 proto kernel scope link src 10.10.10.122Cause: there is no default route.
Fix: gw=10.10.10.1 back on net0:
pct set 122 --net0 name=eth0,bridge=vmbr1,gw=10.10.10.1,hwaddr=BC:24:11:10:9A:74,ip=10.10.10.122/24,tag=10,type=vethdefault via 10.10.10.1 dev eth01 packets transmitted, 1 received, 0% packet loss, time 0msFailure 5 – Bridge without a physical port
Section titled “Failure 5 – Bridge without a physical port”Triggered: on desopve04, a bridge vmbr7 with no ports is created and CT 404 is connected to it instead of vmbr0.
ip link add vmbr7 type bridge && ip link set vmbr7 uppct set 404 --net0 bridge=vmbr7,name=eth0,gw=172.27.199.1,hwaddr=BC:24:11:3C:C6:8C,ip=172.27.199.125/24,ip6=auto,type=vethSymptom: the CT is running and its interface is UP, but it cannot even reach the gateway.
2 packets transmitted, 0 received, 100% packet loss, time 1015msCheck: which bridge it is connected to and which ports that bridge has.
bridge=vmbr7porte di vmbr7:veth404i0@nic0: 1500 master vmbr7 state forwardingporte di vmbr0:nic0: 1500 master vmbr0 state forwardingCause: the only port of vmbr7 is the CT’s veth. There is no physical NIC and therefore no way out of the node. It is the same behavior, intentional there, as the private network vmbr9 of Lab 24, which reaches the outside only through the node’s routing.
Fix: the CT goes back to vmbr0 and the test bridge is deleted:
pct set 404 --net0 bridge=vmbr0,name=eth0,gw=172.27.199.1,hwaddr=BC:24:11:3C:C6:8C,ip=172.27.199.125/24,ip6=auto,type=vethip link del vmbr72 packets transmitted, 2 received, 0% packet loss, time 1002msFailure 6 – Duplicate IP address
Section titled “Failure 6 – Duplicate IP address”Triggered: the address of CT 122 is added to CT 121 by mistake.
pct exec 121 -- ip addr add 10.10.10.122/24 dev eth0Expected symptom, not reproduced in this run, which goes straight to the check: connections to 10.10.10.122 that sometimes work and sometimes do not, and sessions that drop, depending on which MAC address the other hosts have in their cache.
Check: the duplicate address detection of arping (-D) from CT 122 on its own address. The command is not in the template: install it in CT 122, which reaches the outside through router01, after setting the apt proxy as in the VMs of step 1 (pct exec 122 -- apt-get install -y iputils-arping). Before the failure nobody replies (exit code 0); afterwards another MAC address replies (exit code 1):
ARPING 10.10.10.122 from 0.0.0.0 eth0Sent 2 probes (2 broadcast(s))Received 0 response(s)exit=0-- con il doppione:ARPING 10.10.10.122 from 0.0.0.0 eth0Unicast reply from 10.10.10.122 [BC:24:11:AF:BC:FC] 1.407msSent 1 probes (1 broadcast(s))Received 1 response(s)exit=1Cause: the MAC address that replies, bc:24:11:af:bc:fc, is the one of CT 121. The bc:24:11 prefix identifies a Proxmox VE virtual network device; from there, with bridge fdb or by searching for the MAC address in the guest configurations, you can trace it back to the guest.
Fix: remove the address from CT 121, on desopve01: pct exec 121 -- ip addr del 10.10.10.122/24 dev eth0.
7. A sign to keep an eye on: repeated NAT rules
Section titled “7. A sign to keep an eye on: repeated NAT rules”In the NAT table of desopve02, the SNAT rules of the SDN zones appear several times:
iptables -t nat -S POSTROUTING | sort | uniq -c | sort -rn | head -4 12 -A POSTROUTING -s 10.60.60.0/24 -o vmbr0 -j SNAT --to-source 172.27.199.22 5 -A POSTROUTING -s 10.72.72.0/24 -o vmbr0 -j SNAT --to-source 172.27.199.22 5 -A POSTROUTING -s 10.71.71.0/24 -o vmbr0 -j SNAT --to-source 172.27.199.22 1 -P POSTROUTING ACCEPTThis is consistent with the mechanism seen in Lab 24, here with rules generated by the SDN: every network reload (ifreload, including the one triggered by the SDN Apply) re-runs the post-up commands that add the rule. To check it, find the lines that add them (grep -rn SNAT /etc/network/interfaces.d/) and count the copies before and after the next ifreload -a or Apply: if the explanation is right, each rule gains one copy. Here it does no harm, because the first matching rule wins and the copies are identical. It becomes a problem, however, when a rule is changed: the old one stays in the table, ahead of the new one. Rebooting the node rebuilds the table from scratch.
Verification and tests
Section titled “Verification and tests”The lab has succeeded when every measurement has its before and after under the same conditions, and every failure returns to the initial behavior once fixed. The observed values are those of the run described in Test environment and versions.
| Test | Success criterion | Observed in this run |
|---|---|---|
| Multiqueue 1 → 4 queues, 4 streams between two VMs on the same node | before and after measured, two rounds, same conditions | from 11.8-12.7 to 9.7-9.8 Gbit/s: no benefit in this lab |
rate=10 towards the VM |
close to 83.9 Mbit/s, few retransmissions | 80.0 Mbit/s (receiver), 4 retransmissions |
rate=10 from the VM |
below the limit, with retransmissions (policing) | 50.1 Mbit/s (receiver), 4639 retransmissions |
| MTU of the management network | 1472 bytes of data get through, 1473 refused by the guest | as expected |
| Failure 1 VLAN | found with bridge vlan and tcpdump -e; ping works again |
found and fixed |
| Failure 2 VXLAN MTU | found with ping -M do; ping works again with MTU 1450 |
found and fixed |
| Failure 3 firewall rule | found in the compiled rules (no log); HTTP ok again |
found and fixed |
| Failure 4 gateway | found with ip route; default route back |
found and fixed |
| Failure 5 bridge without a port | found with bridge link; ping works again |
found and fixed |
| Failure 6 duplicate IP | found with arping -D (exit code 1, MAC of CT 121) |
found and fixed |
Final lab state
Section titled “Final lab state”- VM 341
perf-341and VM 342perf-342: deleted at the end of the measurements, ondesopve01, withqm stop <id> && qm destroy <id> --purge. - Guests used for the failures: CTs 122, 291, 101, 121 and 404 restored exactly to their starting configuration, verified after each fix. The test bridge
vmbr7ondesopve04was deleted. Theiputils-arpingpackage remains installed in CT 122. - Repeated NAT rules: left as they are; they are cleared at the next reboot of the nodes.
- Track B is complete: network, SDN and firewall remain configured as described in the final states of labs 20-33.
What you learned
Section titled “What you learned”- When to enable multiqueue: only after a before-and-after measurement with traffic similar to the real one (many connections) and with idle CPUs on the node; here, with 8 vCPUs on 4 cores, the aggregate of four streams dropped by 20%.
- How to use
rateand what to expect: the value is in MiB/s; towards the guest the limit is accurate (shaping), while from the guest the policing drops packets and, with TCP, yields less than the configured value. Before relying on an outbound limit, measure it with your own traffic. - How to read a bandwidth measurement between VMs on the same node: it does not cross the physical network, so it says nothing about ports and switches; what matters is the CPUs, vhost and the offloads.
- Where to start a diagnosis: from the path of the packet (guest, bridge port, VLAN, bond, firewall, conntrack, routing), with the command that shows the state of each segment; an immediate local error (
Network is unreachable) and a timeout point to different segments. - How to make firewall blocks visible:
logon hand-writtenDROPandREJECTrules; without a log, the cause only shows up in the compiled rules (nft list ruleset).
References
Section titled “References”- Proxmox VE – Network Device: Multiqueue
- Proxmox VE –
qm: therateoption of network devices (net[n]) - Proxmox VE – Network Configuration
- Linux 7.0 – bonding driver
- iproute2 – bridge(8)
tc-htb(8): shaping on thetapegresstc-police(8): policing on ingress- iperf3 – the
-Pand-Roptions, sender and receiver lines